 W
W
Municipalities
Waterberg District Municipality (DC36)
Metropolitan, district, and local municipalities across South Africa.
DC36
Active
https://www.waterberg.gov.za
Overview
Waterberg District Municipality (DC36) is a Limpopo district authority responsible for coordinating regional development planning and providing shared support across its local municipalities. It focuses on district-wide strategies, infrastructure coordination and capacity support where collaboration improves delivery outcomes. The district supports cooperative governance and alignment of municipal priorities with wider programmes, strengthening monitoring and resilience planning across the district area.
Geography, History & Economy
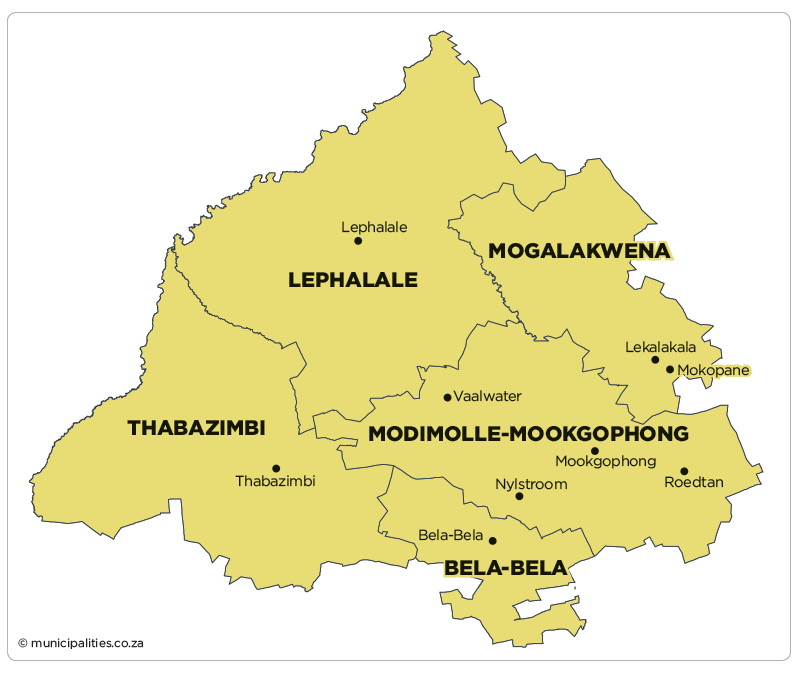
- Bela-Bela Local Municipality
- Lephalale Local Municipality
- Modimolle-Mookgophong Local Municipality
- Mogalakwena Local Municipality
- Thabazimbi Local Municipality
Map
Council & Management
Composition of Council:
ANC 21, EFF 6, DA7, TRA 1, FF+1
Controlling Party:
n/a
Mayor:
Mr MJ Maeko (ANC)
Deputy Mayor:
n/a
Speaker:
Ms Grace Marakalal (ANC)
Chief Whip:
B Monare
Other Council:
MJ Gumede (MMC: Community Services)
MH Ledwaba (MMC: Social Development)
PS Mabe (MPAC Chairperson)
MJ Maeko (MMC: Planning and Economic Development)
KB Mangakeng (MMC: Budget and Treasury)
SR Masipa (MMC: Infrastructure and Development)
NS Morumudi (MMC: Transformation and Administration)
MS Taueatsoala (MMC: Special Projects)
Municipal Manager:
P Raputsoa
Chief Financial Officer:
T Tebjani
Senior Management:
VS Kubheka (Manager: Planning and Economic Development)
P Makondo (Executive Assistant)
B Mthombene (Acting Manager: Infrastructure and Development)
MZ Namate (Manager: Social Development and Shared Services)
M Tsebe (Manager: Corporate Support and Shared Services)
Communications Officers:
Kabelo Mosito (Divisional Manager: Communications, IGR and Protocol)
Demographic Information
| 2022 | 2016 | 2011 | |
| Population | 762 862 | 745 758 | 679 336 |
| Age Structure | |||
| Population under 15 | 27.9% | 34.4% | 29.9% |
| Population 15 to 64 | 64.5% | 60.5% | 64.3% |
| Population over 65 | 7.5% | 5.1% | 5.8% |
| Dependency Ratio | |||
| Per 100 (15-64) | 54.9 | 65.4 | 55.5 |
| Sex Ratio | |||
| Males per 100 females | 96.7 | 104.7 | 102.1 |
| Population Growth | |||
| Per annum | 1.13% | 2.12% | n/a |
| Labour Market | |||
| Unemployment rate (official) | n/a | n/a | 28.1% |
| Youth unemployment rate (official) 15-34 | n/a | n/a | 35.5% |
| Education (aged 20 +) | |||
| No schooling | 8.3% | 7.1% | 12.4% |
| Matric | n/a | 27.6% | 23.2% |
| Higher education | 9.7% | 9.0% | 8.5% |
| Household Dynamics | |||
| Households | 248 526 | 211 471 | 179 858 |
| Average household size | 3.1 | 3.5 | 3.8 |
| Female headed households | n/a | 40.9% | 42.7% |
| Formal dwellings | 91.6% | 85.0% | 87.0% |
| Housing owned | n/a | 63.6% | 47.7% |
| Household Services | |||
| Flush toilet connected to sewerage | 57.6% | 43.8% | 47.8% |
| Weekly refuse removal | 52.6% | 44.4% | 44.2% |
| Piped water inside dwelling | 44.7% | 24.4% | 30.7% |
| Electricity for lighting | 92.9% | 86.1% | 86.7% |
Financial Results
| All values: R'000 | 2024/25 | 2023/24 | 2022/23 | 2021/22 | 2020/21 |
| AUDIT OUTCOME | n/a | Clean audit | Financially unqualified | Clean audit | Clean audit |
| FINANCIAL PERFORMANCE | |||||
| Property rates | - | - | - | - | - |
| Service charges | - | - | - | - | - |
| Investment revenue | 2 284 | 3 271 | 3 029 | 2 718 | 3 517 |
| Transfers recognised - operational | 160 288 | 154 295 | 149 388 | 143 766 | 146 353 |
| Other own revenue | 2 831 | 2 197 | 2 520 | 1 522 | 1 419 |
| Total Revenue (excluding capital transfers and contributions) | 165 402 | 159 763 | 154 937 | 148 006 | 151 289 |
| Employee costs | 126 415 | 123 997 | 116 764 | 115 753 | 107 463 |
| Remuneration of councillors | 9 374 | 9 348 | 9 008 | 8 305 | 8 421 |
| Depreciation and amortisation | 6 731 | 5 895 | 4 675 | 7 218 | 7 894 |
| Finance charges | - | - | - | - | - |
| Inventory consumed and bulk purchases | - | - | - | 224 | 3 815 |
| Transfers and subsidies | - | - | - | - | - |
| Other expenditure | 47 241 | 41 717 | 41 232 | 43 992 | 39 228 |
| Total Expenditure | 189 761 | 180 957 | 171 680 | 175 491 | 166 821 |
| Surplus/(Deficit) | (24 359) | (21 194) | (16 743) | (27 486) | (15 532) |
| Transfers and subsidies - capital (monetary allocations) | - | - | - | - | - |
| Transfers and subsidies - capital (in-kind) | - | - | - | - | - |
| Surplus/(Deficit) after capital transfers & contributions | (24 359) | (21 194) | (16 743) | (27 486) | (15 532) |
| Share of surplus/(deficit) of associate | - | - | - | - | - |
| Surplus/(Deficit) for the year | (24 359) | (21 194) | (16 743) | (27 486) | (15 532) |
| CAPITAL EXPENDITURE & FUNDS SOURCES | |||||
| Capital expenditure | 60 | 450 | 1 122 | 1 174 | 4 468 |
| Transfers recognised - capital | - | - | - | - | - |
| Borrowing | - | - | - | - | - |
| Internally generated funds | - | 450 | 1 000 | 673 | 4 468 |
| Total sources of capital funds | - | 450 | 1 000 | 673 | 4 468 |
| FINANCIAL POSITION | |||||
| Total current assets | 3 627 | 9 129 | 16 922 | 32 790 | 52 326 |
| Total non current assets | 66 423 | 74 085 | 78 681 | 81 118 | 86 487 |
| Total current liabilities | 41 168 | 26 379 | 21 704 | 25 213 | 25 314 |
| Total non current liabilities | 23 028 | 25 484 | 22 811 | 22 410 | 21 340 |
| Community wealth/Equity | 5 854 | 31 350 | 50 490 | 65 533 | 92 052 |
| CASH FLOWS | |||||
| Net cash from (used) operating | (7 281) | (8 073) | (12 442) | (19 460) | 11 136 |
| Net cash from (used) investing | (1) | - | (324) | (109) | (624) |
| Net cash from (used) financing | - | - | - | - | - |
| Cash/cash equivalents at the year end | (1 892) | 4 700 | 15 347 | 28 164 | 131 126 |
| UNAUTHORISED, IRREGULAR, FRUITLESS & WASTEFUL EXPENDITURE | |||||
| Unauthorised expenditure | n/a | - | - | - | - |
| Irregular expenditure | n/a | - | - | - | 1 466 |
| Fruitless & wasteful expenditure | n/a | - | - | - | - |
| SOURCE | Audited Outcome A1 2026 Q1 | Audited Outcome A1 2026 Q1 | Audited Outcome A1 2026 Q1 | Audited Outcome A1 2024 | Audited Outcome A1 2023 |
Employment Statistics
| 2022/23 | 2021/22 | 2020/21 | 2019/20 | 2018/19 | |
| Employment | |||||
| Employment Costs (R’000) | 116 764 | 115 753 | 107 463 | 102 401 | 91 782 |
| Remuneration of councillors (R’000) | 9 008 | 8 305 | 8 421 | 8 239 | 8 262 |
| Total Employee Positions | 214 | 221 | 180 | 192 | 191 |
| Total Vacant Employee Positions | 36 | 0 | 2 | 14 | 4 |
| Total Vacancy Percentage | 16.82% | 0.00% | 1.11% | 7.29% | 2.09% |
| Managerial Positions – S54A and S56 | 6 | 6 | 6 | 6 | 6 |
| Vacant Managerial Positions – S54A and S56 | 2 | 0 | 2 | 2 | 3 |
| Managerial Positions - by organogram | 24 | 18 | 18 | 18 | 17 |
| Vacant Managerial Positions - by organogram | 1 | 0 | 0 | 0 | 1 |
Service Delivery Statistics
| 2022/23 | 2021/22 | 2020/21 | 2019/20 | 2018/19 | |
| Water | |||||
| Does the municipality provide? | No | No | No | No | No |
| Number of households and non-domestic customers to which provided | 0 | 0 | 0 | 0 | 0 |
| Number of domestic households/delivery points | 0 | 0 | 0 | 0 | 0 |
| Inside the yard | 0 | 0 | 0 | 0 | 0 |
| Less than 200m from yard | 0 | 0 | 0 | 0 | 0 |
| More than 200m from yard | 0 | 0 | 0 | 0 | 0 |
| Domestic households with access to free basic service | 0 | 0 | 0 | 0 | 0 |
| Electricity | |||||
| Does the municipality provide? | No | No | No | No | No |
| Number of households and non-domestic customers to which provided | 0 | 0 | 0 | 0 | 0 |
| Domestic households with access to free basic service | 0 | 0 | 0 | 0 | 0 |
| Sewerage and Sanitation | |||||
| Does the municipality provide? | No | No | No | No | No |
| Number of households and non-domestic customers to which provided | 0 | 0 | 0 | 0 | 0 |
| Number of households using: | |||||
| Flush toilet - public sewerage | 0 | 0 | 0 | 0 | 0 |
| Flush toilet - septic tank | 0 | 0 | 0 | 0 | 0 |
| Ventilated pit latrine | 0 | 0 | 0 | 0 | 0 |
| Bucket system | 0 | 0 | 0 | 0 | 0 |
| Other | 0 | 0 | 0 | 0 | 0 |
| Domestic households with access to free basic service | 0 | 0 | 0 | 0 | 0 |
| Solid Waste Services | |||||
| Does the municipality provide? | No | No | No | No | No |
| Number of households and non-domestic customers to which provided | 0 | 0 | 0 | 0 | 0 |
| Domestic households with access to free basic service | 0 | 0 | 0 | 0 | 0 |