 P
P
Municipalities
Polokwane Local Municipality (LIM354)
Metropolitan, district, and local municipalities across South Africa.
LIM354
Active
https://www.polokwane.gov.za
Overview
Polokwane Local Municipality (LIM354) is a Limpopo local authority responsible for municipal governance, service delivery and development planning within its jurisdiction. It manages municipal administration, maintains infrastructure and public amenities, and implements spatial planning and regulatory processes that guide development and service upgrades. Through long-term plans, the IDP and annual budgets, the municipality prioritises service improvements, infrastructure renewal and initiatives that support residents and local business.
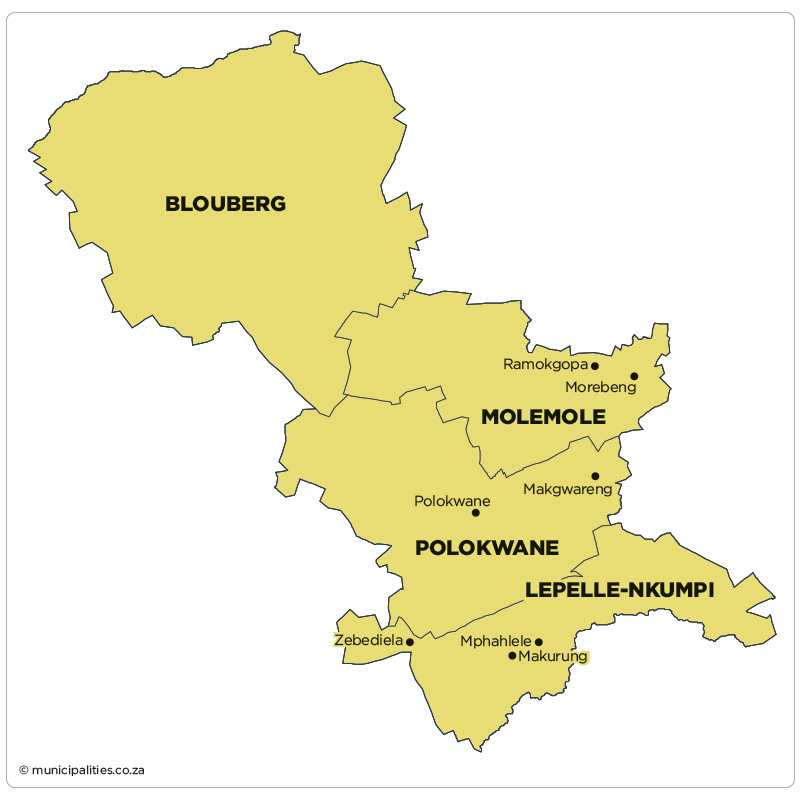
Map
Council & Management
Composition of Council:
ANC 57, EFF 20, DA 7, VF PLUS 2, ABC 1, ACDP 1, COPE 1, MSM 1
Controlling Party:
ANC
Mayor:
Mr Mosema Makoro John Mpe (ANC)
Speaker:
Ms Kobela Whelemina Modiba (ANC)
Chief Whip:
Mr Phethola Adolf Rapetswa
Other Council:
Mrs Makwena Betty Kgare (MMC: Admin and Governance)
Ms Jeneffer Malope (MMC: Waste and Environment)
Mr Tebele Jerry Mamabolo (MMC: Sports, Arts, Culture and Special Programmes)
Zanele Fikile Mashalane (MMC: Human Settlements)
Mrs Puleng Mashangoane (MMC: Local Economic Development, Land Use and Spatial Planning)
Mr Alfred Moakamedi (MMC: Waste and Sanitation)
Mr Thabang Desmond Moloto (MMC: Roads, Transport and Stormwater)
Mr Tshepo Nkwe (MMC: Finance)
Mr Joosuf Pemma (MMC: Community Safety)
Ms Nomonde Albertina Sivhabu (MMC: Energy Services )
Municipal Manager:
Ms Thuso Nemugumoni (City Manager)
Chief Financial Officer:
Mr Thabo Nonyane (Group Chief Financial Officer)
Senior Management:
Ms Prudence Chepape (Deputy Group Chief Financial Officer)
Mr Edward Hutamo (Executive Director: Community Services)
Ms Rirhandzu Mabunda (Executive Director: Roads and Storm Water)
Ms Molatelo Mashego (Executive Director: Planning Economic and Development)
Mr Phuti Donald Matsi (Executive Director: Corporate and Shared Services)
Mothobi Mokaeane (Chief Executive Officer: Polokwane Housing Association)
Mr Vheli Mthombeni (Acting: Chief Operations Officer)
Mr David Ramakgwakgwa (Director: Transportation Services)
Communications Officers:
Mr Thipa Selala (Manager: Communication and Marketing)
Demographic Information
| 2022 | 2016 | 2011 | |
| Population | 843 459 | 797 127 | 728 633 |
| Age Structure | |||
| Population under 15 | 28.1% | 30.7% | 31.1% |
| Population 15 to 64 | 65.1% | 64.4% | 63.2% |
| Population over 65 | 6.8% | 4.9% | 5.7% |
| Dependency Ratio | |||
| Per 100 (15-64) | 53.6 | 55.4 | 58.2 |
| Sex Ratio | |||
| Males per 100 females | 93.2 | 92.8 | 91.1 |
| Population Growth | |||
| Per annum | 1.42% | 2.04% | n/a |
| Labour Market | |||
| Unemployment rate (official) | n/a | n/a | n/a |
| Youth unemployment rate (official) 15-34 | n/a | n/a | n/a |
| Education (aged 20 +) | |||
| No schooling | 6.6% | 9.2% | 7.7% |
| Matric | n/a | 33.9% | 28.4% |
| Higher education | 16.8% | 13.6% | 15.7% |
| Household Dynamics | |||
| Households | 249 443 | 239 116 | 203 605 |
| Average household size | 3.4 | 3.3 | 3.6 |
| Female headed households | n/a | 44.9% | 46.2% |
| Formal dwellings | 95.0% | 93.4% | 90.2% |
| Housing owned | n/a | 67.3% | 55.2% |
| Household Services | |||
| Flush toilet connected to sewerage | 48.3% | 40.4% | 38.6% |
| Weekly refuse removal | 46.5% | 38.8% | 38.9% |
| Piped water inside dwelling | 41.4% | 26.3% | 30.4% |
| Electricity for lighting | 95.0% | 94.4% | 83.0% |
Financial Results
| All values: R'000 | 2024/25 | 2023/24 | 2022/23 | 2021/22 | 2020/21 |
| AUDIT OUTCOME | n/a | Financially unqualified | Financially unqualified | Financially unqualified | Qualified audit |
| FINANCIAL PERFORMANCE | |||||
| Property rates | 710 102 | 593 067 | 572 860 | 528 180 | 470 568 |
| Service charges | 2 215 759 | 1 966 740 | 1 735 462 | 1 815 516 | 1 581 445 |
| Investment revenue | 69 806 | 48 178 | 38 815 | 9 641 | 12 333 |
| Transfers recognised - operational | 1 678 654 | 1 538 725 | 1 403 549 | 1 215 946 | 1 386 384 |
| Other own revenue | 1 306 963 | 298 131 | 417 518 | 461 346 | 207 420 |
| Total Revenue (excluding capital transfers and contributions) | 5 981 284 | 4 444 841 | 4 168 205 | 4 030 630 | 3 658 151 |
| Employee costs | 1 094 965 | 1 114 536 | 1 072 016 | 1 026 750 | 973 200 |
| Remuneration of councillors | 83 711 | 43 877 | 41 384 | 39 349 | 38 692 |
| Depreciation and amortisation | 901 325 | 1 192 608 | 754 453 | 784 230 | 961 689 |
| Finance charges | 52 064 | 50 808 | 57 837 | 59 737 | 61 770 |
| Inventory consumed and bulk purchases | 1 472 019 | 1 293 899 | 1 082 468 | 1 132 232 | 1 026 606 |
| Transfers and subsidies | 16 480 | 15 480 | 9 671 | 45 240 | 66 558 |
| Other expenditure | 2 632 910 | 1 647 500 | 2 105 950 | 1 914 296 | 1 256 226 |
| Total Expenditure | 6 253 474 | 5 358 708 | 5 123 780 | 5 001 835 | 4 384 743 |
| Surplus/(Deficit) | (272 190) | (913 867) | (955 575) | (971 206) | (726 592) |
| Transfers and subsidies - capital (monetary allocations) | 615 386 | 770 125 | 612 013 | 655 398 | 764 993 |
| Transfers and subsidies - capital (in-kind) | 13 781 | 5 185 | 576 | - | - |
| Surplus/(Deficit) after capital transfers & contributions | 356 977 | (138 558) | (342 986) | (315 807) | 38 401 |
| Share of surplus/(deficit) of associate | - | - | - | - | - |
| Surplus/(Deficit) for the year | 356 977 | (138 558) | (342 986) | (315 807) | 38 401 |
| CAPITAL EXPENDITURE & FUNDS SOURCES | |||||
| Capital expenditure | 791 402 | 870 919 | 625 278 | 685 491 | 840 161 |
| Transfers recognised - capital | 536 998 | 634 351 | 517 418 | 519 741 | 693 246 |
| Borrowing | - | - | - | - | (885) |
| Internally generated funds | 254 403 | 236 568 | 103 833 | 165 299 | 143 098 |
| Total sources of capital funds | 791 402 | 870 919 | 621 251 | 685 040 | 835 459 |
| FINANCIAL POSITION | |||||
| Total current assets | 2 272 128 | 1 673 218 | 1 547 283 | 1 576 111 | 1 537 643 |
| Total non current assets | 15 612 386 | 15 658 783 | 15 888 046 | 13 823 638 | 17 201 480 |
| Total current liabilities | 1 172 117 | 979 703 | 874 242 | 1 216 851 | 1 145 449 |
| Total non current liabilities | 872 326 | 869 203 | 866 679 | 916 062 | 971 218 |
| Community wealth/Equity | 15 840 071 | 15 483 095 | 15 693 135 | 13 360 488 | 16 627 984 |
| CASH FLOWS | |||||
| Net cash from (used) operating | 1 398 971 | 1 460 402 | 3 349 876 | 2 018 931 | 3 973 179 |
| Net cash from (used) investing | (765 635) | (910 977) | (743 683) | (831 503) | (733 869) |
| Net cash from (used) financing | - | - | - | - | (499) |
| Cash/cash equivalents at the year end | 976 612 | 733 795 | 2 838 862 | 1 488 583 | 2 476 525 |
| UNAUTHORISED, IRREGULAR, FRUITLESS & WASTEFUL EXPENDITURE | |||||
| Unauthorised expenditure | n/a | 932 059 | 1 040 557 | 1 669 132 | 614 253 |
| Irregular expenditure | n/a | 432 463 | 255 808 | 167 257 | 72 935 |
| Fruitless & wasteful expenditure | n/a | 6 105 | - | 17 125 | 18 |
| SOURCE | Audited Outcome A1 2026 Q1 | Audited Outcome A1 2026 Q1 | Audited Outcome A1 2026 Q1 | Audited Outcome A1 2024 | Audited Outcome A1 2023 |
Employment Statistics
| 2022/23 | 2021/22 | 2020/21 | 2019/20 | 2018/19 | |
| Employment | |||||
| Employment Costs (R’000) | 1 072 016 | 1 026 750 | 973 200 | 922 982 | 854 608 |
| Remuneration of councillors (R’000) | 41 384 | 39 349 | 38 692 | 38 522 | 37 955 |
| Total Employee Positions | 2 564 | 2 088 | 2 088 | 2 063 | 2 951 |
| Total Vacant Employee Positions | 536 | 23 | 11 | 4 | 997 |
| Total Vacancy Percentage | 20.90% | 1.10% | 0.53% | 0.19% | 33.79% |
| Managerial Positions – S54A and S56 | 9 | 9 | 9 | 9 | 9 |
| Vacant Managerial Positions – S54A and S56 | 3 | 5 | 0 | 0 | 2 |
| Managerial Positions - by organogram | 45 | 45 | 45 | 45 | 40 |
| Vacant Managerial Positions - by organogram | 11 | 18 | 11 | 4 | 4 |
Service Delivery Statistics
| 2022/23 | 2021/22 | 2020/21 | 2019/20 | 2018/19 | |
| Water | |||||
| Does the municipality provide? | Yes | Yes | Yes | Yes | Yes |
| Number of households and non-domestic customers to which provided | 207 403 | 207 403 | 205 367 | 172 641 | 194 236 |
| Number of domestic households/delivery points | 203 554 | 203 554 | 201 518 | 168 792 | 190 478 |
| Inside the yard | 147 934 | 147 934 | 145 898 | 142 601 | 135 632 |
| Less than 200m from yard | 16 170 | 16 170 | 16 170 | 16 870 | 38 586 |
| More than 200m from yard | 39 450 | 39 450 | 39 450 | 9 321 | 16 260 |
| Domestic households with access to free basic service | 6 629 | 6 804 | 12 906 | 12 906 | 11 910 |
| Electricity | |||||
| Does the municipality provide? | Yes | Yes | Yes | Yes | Yes |
| Number of households and non-domestic customers to which provided | 286 873 | 286 873 | 286 223 | 240 544 | 239 116 |
| Domestic households with access to free basic service | 6 629 | 6 209 | 11 877 | 11 877 | 10 898 |
| Sewerage and Sanitation | |||||
| Does the municipality provide? | Yes | Yes | Yes | Yes | Yes |
| Number of households and non-domestic customers to which provided | 180 869 | 180 869 | 180 701 | 178 309 | 167 196 |
| Number of households using: | |||||
| Flush toilet - public sewerage | 81 839 | 81 839 | 81 671 | 79 891 | 72 627 |
| Flush toilet - septic tank | 305 | 305 | 305 | 0 | 0 |
| Ventilated pit latrine | 94 569 | 94 569 | 94 569 | 94 569 | 94 569 |
| Bucket system | 0 | 0 | 0 | 0 | 0 |
| Other | 307 | 307 | 307 | 0 | 0 |
| Domestic households with access to free basic service | 6 629 | 6 804 | 12 702 | 11 877 | 10 898 |
| Solid Waste Services | |||||
| Does the municipality provide? | Yes | Yes | Yes | Yes | Yes |
| Number of households and non-domestic customers to which provided | 104 078 | 104 078 | 103 682 | 103 537 | 103 585 |
| Domestic households with access to free basic service | 6 629 | 6 986 | 12 996 | 12 906 | 12 196 |