 O
O
Municipalities
Oudtshoorn Local Municipality (WC045)
Metropolitan, district, and local municipalities across South Africa.
WC045
Active
https://www.oudtshoorn.gov.za
Overview
Oudtshoorn Local Municipality (WC045) is a Western Cape local authority responsible for municipal governance, service delivery and development planning within its jurisdiction. It manages municipal administration, maintains infrastructure and public facilities, and implements planning and regulatory processes that guide service upgrades and orderly growth. Through the IDP and annual budgets, the municipality prioritises reliable services, asset maintenance and community-focused development initiatives.
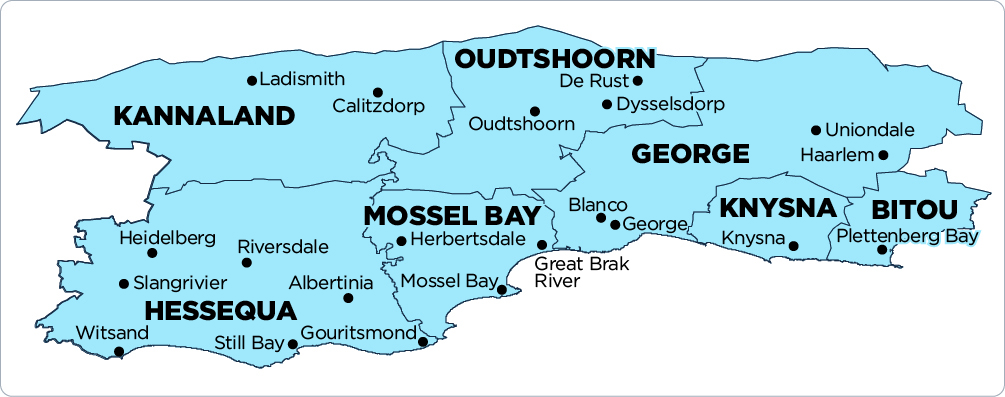
Map
Council & Management
Composition of Council:
ANC 7, DA 7, VF PLUS 3, ICOSA 2, PA 2, ADVIESKANTOOR 1, GOOD 1, OGI 1, SUID-KAAP SAAMSTAAN 1
Controlling Party:
ANC, Advieskantoor, FF+, PA Coalition
Executive Mayor:
Mr Johan Allers (VF+)
Deputy Mayor:
Mr Tyatya (ANC)
Speaker:
Ms S Jansen (PA)
Chief Whip:
Mr J Duvenhage
Other Council:
L Campher (Portfolio Chairperson: Planning and Development)
NM Jaxa (Portfolio Chairperson: Infrastructure Services)
DV Moos (Portfolio Chairperson: Corporate Services)
CF Sylvester (Portfolio Chairperson: Financial Services)
A Tiemie (Portfolio Chairperson: Community Services)
Municipal Manager:
Mr M Yekani
Chief Financial Officer:
Mr GP de Jager
Senior Management:
Mr CAS Avontuur (Legal Services)
Mr Ian Avontuur (Director: Community Services)
Mr LA Coetzee (Planning and Development)
Mr Earl John Jantjies (Acting Director: Corporate Services)
Mr J Lesch (Director: Infrastructure Services)
Mr J Prinsloo (Roads, Transport and Stormwater)
Mrs S Swart (Accounting Services)
Communications Officers:
Mrs A Mle (Media and Communications)
Demographic Information
| 2022 | 2016 | 2011 | |
| Population | 138 257 | 97 509 | 95 933 |
| Age Structure | |||
| Population under 15 | 25.2% | 27.7% | 28.7% |
| Population 15 to 64 | 66.9% | 65.1% | 64.2% |
| Population over 65 | 8.0% | 7.2% | 7.2% |
| Dependency Ratio | |||
| Per 100 (15-64) | 49.6 | 53.7 | 55.8 |
| Sex Ratio | |||
| Males per 100 females | 91.3 | 92.3 | 91.8 |
| Population Growth | |||
| Per annum | 3.55% | 0.37% | n/a |
| Labour Market | |||
| Unemployment rate (official) | n/a | n/a | 25.3% |
| Youth unemployment rate (official) 15-34 | n/a | n/a | 35.9% |
| Education (aged 20 +) | |||
| No schooling | 2.4% | 2.3% | 4.5% |
| Matric | n/a | 34.2% | 25.1% |
| Higher education | 9.7% | 6.5% | 6.6% |
| Household Dynamics | |||
| Households | 31 795 | 23 362 | 21 910 |
| Average household size | 4.3 | 4.2 | 4.4 |
| Female headed households | n/a | 38.8% | 36.2% |
| Formal dwellings | 89.5% | 91.2% | 88.5% |
| Housing owned | n/a | 66.4% | 61.7% |
| Household Services | |||
| Flush toilet connected to sewerage | 88.5% | 88.1% | 80.4% |
| Weekly refuse removal | 86.0% | 87.4% | 78.0% |
| Piped water inside dwelling | 85.1% | 83.8% | 74.5% |
| Electricity for lighting | 92.3% | 90.2% | 85.2% |
Financial Results
| All values: R'000 | 2024/25 | 2023/24 | 2022/23 | 2021/22 | 2020/21 |
| AUDIT OUTCOME | n/a | Financially unqualified | Clean audit | Financially unqualified | Financially unqualified |
| FINANCIAL PERFORMANCE | |||||
| Property rates | 161 715 | 128 895 | 116 473 | 104 563 | 97 889 |
| Service charges | 523 888 | 464 000 | 412 092 | 406 821 | 355 459 |
| Investment revenue | 15 426 | 14 999 | 11 878 | 6 818 | 5 749 |
| Transfers recognised - operational | 117 990 | 137 929 | 103 865 | 96 933 | 103 919 |
| Other own revenue | 78 509 | 65 351 | 75 976 | 43 277 | 29 673 |
| Total Revenue (excluding capital transfers and contributions) | 897 528 | 811 174 | 720 285 | 658 413 | 592 688 |
| Employee costs | 323 546 | 295 718 | 280 368 | 268 046 | 261 060 |
| Remuneration of councillors | 13 820 | 12 588 | 11 391 | 10 870 | 10 994 |
| Depreciation and amortisation | 63 776 | 50 916 | 52 884 | 45 974 | 40 313 |
| Finance charges | 20 490 | 8 468 | 7 935 | 4 890 | 4 161 |
| Inventory consumed and bulk purchases | 311 736 | 303 089 | 229 036 | 231 007 | 195 231 |
| Transfers and subsidies | 3 085 | 3 434 | 3 045 | 3 555 | 1 959 |
| Other expenditure | 194 199 | 137 471 | 144 039 | 114 227 | 96 567 |
| Total Expenditure | 930 651 | 811 685 | 728 698 | 678 568 | 610 285 |
| Surplus/(Deficit) | (33 123) | (511) | (8 413) | (20 155) | (17 596) |
| Transfers and subsidies - capital (monetary allocations) | 32 820 | 36 094 | 79 980 | 45 911 | 59 409 |
| Transfers and subsidies - capital (in-kind) | 123 | - | 722 | 266 | 39 067 |
| Surplus/(Deficit) after capital transfers & contributions | (179) | 35 583 | 72 289 | 26 022 | 80 880 |
| Share of surplus/(deficit) of associate | - | - | - | - | - |
| Surplus/(Deficit) for the year | (179) | 35 583 | 72 289 | 26 022 | 80 880 |
| CAPITAL EXPENDITURE & FUNDS SOURCES | |||||
| Capital expenditure | 114 609 | 61 233 | - | - | - |
| Transfers recognised - capital | - | - | - | - | - |
| Borrowing | - | - | - | - | - |
| Internally generated funds | - | - | - | - | - |
| Total sources of capital funds | - | - | - | - | - |
| FINANCIAL POSITION | |||||
| Total current assets | 297 206 | 262 479 | 235 091 | 232 887 | 189 639 |
| Total non current assets | 1 223 452 | 1 146 916 | 1 167 671 | 1 084 280 | 1 009 780 |
| Total current liabilities | 156 640 | 130 644 | 144 098 | 129 657 | 95 575 |
| Total non current liabilities | 282 750 | 218 615 | 215 231 | 241 859 | 202 933 |
| Community wealth/Equity | 1 081 447 | 1 024 553 | 971 144 | 919 630 | 820 031 |
| CASH FLOWS | |||||
| Net cash from (used) operating | (1 966) | (21 218) | (268 425) | 134 857 | 286 404 |
| Net cash from (used) investing | (63 222) | (57 546) | (104 185) | (69 265) | - |
| Net cash from (used) financing | - | 16 290 | - | - | 87 |
| Cash/cash equivalents at the year end | 78 714 | 45 749 | (228 672) | 154 061 | (933 952) |
| UNAUTHORISED, IRREGULAR, FRUITLESS & WASTEFUL EXPENDITURE | |||||
| Unauthorised expenditure | n/a | - | - | 20 591 | - |
| Irregular expenditure | n/a | 25 912 | 5 357 | 9 933 | 24 615 |
| Fruitless & wasteful expenditure | n/a | - | - | - | - |
| SOURCE | Audited Outcome A1 2026 Q1 | Audited Outcome A1 2026 Q1 | Audited Outcome A1 2026 Q1 | Audited Outcome A1 2024 | Audited Outcome A1 2023 |
Employment Statistics
| 2022/23 | 2021/22 | 2020/21 | 2019/20 | 2018/19 | |
| Employment | |||||
| Employment Costs (R’000) | 280 368 | 268 046 | 261 060 | 234 770 | 210 918 |
| Remuneration of councillors (R’000) | 11 391 | 10 870 | 10 994 | 11 213 | 10 897 |
| Total Employee Positions | 834 | 921 | 746 | 790 | 1 013 |
| Total Vacant Employee Positions | 82 | 44 | 6 | 37 | 285 |
| Total Vacancy Percentage | 9.83% | 4.78% | 0.80% | 4.68% | 28.13% |
| Managerial Positions – S54A and S56 | 6 | 6 | 5 | 5 | 6 |
| Vacant Managerial Positions – S54A and S56 | 0 | 3 | 2 | 2 | 0 |
| Managerial Positions - by organogram | 33 | 33 | 33 | 34 | 41 |
| Vacant Managerial Positions - by organogram | 2 | 4 | 4 | 3 | 15 |
Service Delivery Statistics
| 2022/23 | 2021/22 | 2020/21 | 2019/20 | 2018/19 | |
| Water | |||||
| Does the municipality provide? | Yes | Yes | Yes | Yes | Yes |
| Number of households and non-domestic customers to which provided | 18 764 | 16 363 | 16 246 | 16 230 | 17 067 |
| Number of domestic households/delivery points | 18 002 | 15 601 | 15 484 | 15 468 | 16 305 |
| Inside the yard | 15 842 | 15 232 | 15 115 | 15 099 | 15 936 |
| Less than 200m from yard | 2 160 | 369 | 369 | 369 | 369 |
| More than 200m from yard | 0 | 0 | 0 | 0 | 0 |
| Domestic households with access to free basic service | 7 040 | 7 615 | 7 573 | 7 276 | 6 841 |
| Electricity | |||||
| Does the municipality provide? | Yes | Yes | Yes | Yes | Yes |
| Number of households and non-domestic customers to which provided | 17 416 | 17 416 | 17 313 | 17 197 | 17 933 |
| Domestic households with access to free basic service | 7 193 | 7 534 | 7 520 | 6 962 | 6 450 |
| Sewerage and Sanitation | |||||
| Does the municipality provide? | Yes | Yes | Yes | Yes | Yes |
| Number of households and non-domestic customers to which provided | 18 231 | 17 307 | 16 332 | 16 328 | 18 833 |
| Number of households using: | |||||
| Flush toilet - public sewerage | 15 337 | 15 154 | 15 032 | 15 028 | 15 257 |
| Flush toilet - septic tank | 2 160 | 601 | 601 | 601 | 2 877 |
| Ventilated pit latrine | 35 | 276 | 0 | 0 | 0 |
| Bucket system | 0 | 0 | 0 | 0 | 0 |
| Other | 0 | 577 | 0 | 0 | 0 |
| Domestic households with access to free basic service | 6 819 | 7 399 | 7 391 | 7 129 | 6 692 |
| Solid Waste Services | |||||
| Does the municipality provide? | Yes | Yes | Yes | Yes | Yes |
| Number of households and non-domestic customers to which provided | 15 166 | 14 687 | 14 582 | 14 567 | 17 933 |
| Domestic households with access to free basic service | 6 819 | 7 398 | 7 394 | 7 140 | 6 697 |