 M
M
Municipalities
Mossel Bay Local Municipality (WC043)
Metropolitan, district, and local municipalities across South Africa.
WC043
Active
https://www.mosselbay.gov.za
Overview
Mossel Bay Local Municipality (WC043) is a Western Cape local authority responsible for municipal services, governance and development planning. It oversees municipal administration, maintains local infrastructure and public spaces, and implements planning and regulatory controls that support orderly growth and service improvements. Through its IDP and annual budgets, the municipality prioritises reliable services, asset maintenance and development initiatives that support residents, tourism and local business activity.
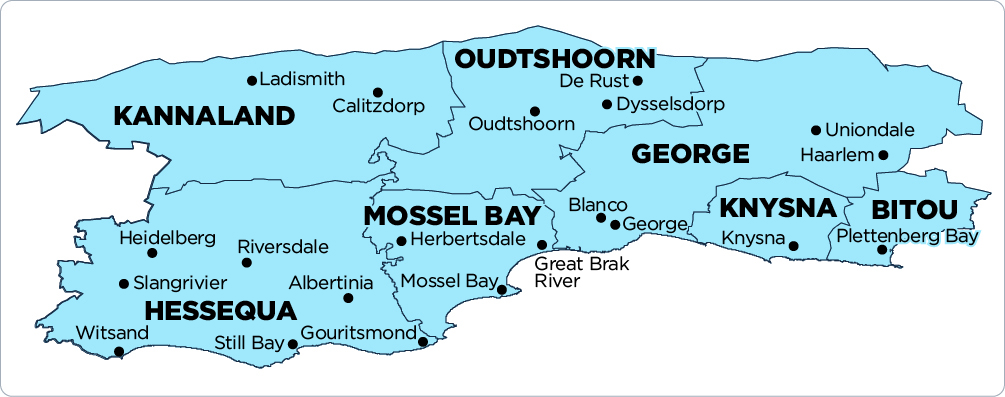
Map
Council & Management
Composition of Council:
DA 18, ANC 5, PA 2, VF PLUS 2, ACDP 1, ICOSA 1
Controlling Party:
DA
Executive Mayor:
Mr Dirk Kotzé (DA)
Mayor:
n/a
Deputy Mayor:
Mr Clifford Bayman (DA)
Speaker:
Ms Venolea Fortuin (DA)
Chief Whip:
Mr Stephan Botha (Council Whip)
Other Council:
Mr Niklaas Booisen (MMC: Community Services)
Mr Anton Dellemijn (MMC: Infrastructure Services)
Mr Mark Furness (MMC: Financial Services)
Ms Nicolette le Roux (MMC: Corporate and Governance Services)
Mr Leon Van Dyk (MMC: Community Safety)
Municipal Manager:
Mr Colin Puren
Chief Financial Officer:
Mr Selwyn Thys
Senior Management:
Mr Dick Naidoo (Director: Infrastructure Services)
Ms Elize Nel (Director: Community Services)
Ms Annette Potgieter (Director: Corporate Services)
Mr Carel Venter (Director: Planning and Economic Development)
Mr H Williamson (Manager: Traffic and Law Enforcement and Acting Director: Community Safety)
Communications Officers:
Ms Cornelle Carstens-Johnston
Demographic Information
| 2022 | 2016 | 2011 | |
| Population | 140 075 | 94 135 | 89 430 |
| Age Structure | |||
| Population under 15 | 17.9% | 22.7% | 23.1% |
| Population 15 to 64 | 66.7% | 66.5% | 66.8% |
| Population over 65 | 15.4% | 10.8% | 10.1% |
| Dependency Ratio | |||
| Per 100 (15-64) | 50.0 | 50.4 | 49.7 |
| Sex Ratio | |||
| Males per 100 females | 93.5 | 94.6 | 95.8 |
| Population Growth | |||
| Per annum | 4.36% | 1.17% | n/a |
| Labour Market | |||
| Unemployment rate (official) | n/a | n/a | 22.9% |
| Youth unemployment rate (official) 15-34 | n/a | n/a | 29.9% |
| Education (aged 20 +) | |||
| No schooling | 2.1% | 2.6% | 2.9% |
| Matric | n/a | 37.6% | 31.9% |
| Higher education | 18.0% | 10.0% | 13.0% |
| Household Dynamics | |||
| Households | 52 985 | 31 766 | 28 023 |
| Average household size | 2.6 | 3.0 | 3.2 |
| Female headed households | n/a | 36.0% | 33.9% |
| Formal dwellings | 92.5% | 88.2% | 85.9% |
| Housing owned | n/a | 76.8% | 60.7% |
| Household Services | |||
| Flush toilet connected to sewerage | 97.1% | 91.1% | 90.9% |
| Weekly refuse removal | 92.5% | 87.2% | 92.6% |
| Piped water inside dwelling | 90.2% | 82.4% | 77.9% |
| Electricity for lighting | 98.2% | 94.3% | 93.8% |
Financial Results
| All values: R'000 | 2024/25 | 2023/24 | 2022/23 | 2021/22 | 2020/21 |
| AUDIT OUTCOME | n/a | Clean audit | Clean audit | Clean audit | Clean audit |
| FINANCIAL PERFORMANCE | |||||
| Property rates | 252 828 | 218 627 | 192 123 | 170 542 | 159 206 |
| Service charges | 1 070 287 | 969 491 | 890 391 | 873 716 | 789 284 |
| Investment revenue | 62 524 | 66 216 | 55 086 | 36 956 | 32 192 |
| Transfers recognised - operational | 160 678 | 173 442 | 142 490 | 138 008 | 191 385 |
| Other own revenue | 175 880 | 146 221 | 137 121 | 147 387 | 74 894 |
| Total Revenue (excluding capital transfers and contributions) | 1 722 196 | 1 573 997 | 1 417 211 | 1 366 610 | 1 246 960 |
| Employee costs | 450 320 | 413 020 | 374 162 | 350 355 | 343 245 |
| Remuneration of councillors | 15 878 | 14 419 | 13 414 | 12 806 | 11 812 |
| Depreciation and amortisation | 145 715 | 150 488 | 137 954 | 368 541 | 97 795 |
| Finance charges | 36 604 | 26 642 | 13 593 | 15 936 | 14 292 |
| Inventory consumed and bulk purchases | 728 222 | 630 401 | 540 682 | 513 494 | 436 561 |
| Transfers and subsidies | 11 458 | 10 990 | 11 529 | 7 841 | 6 188 |
| Other expenditure | 360 174 | 343 803 | 289 207 | 316 060 | 317 805 |
| Total Expenditure | 1 748 372 | 1 589 763 | 1 380 541 | 1 585 033 | 1 227 698 |
| Surplus/(Deficit) | (26 175) | (15 766) | 36 671 | (218 422) | 19 263 |
| Transfers and subsidies - capital (monetary allocations) | 55 460 | 57 379 | 84 396 | 56 297 | 74 699 |
| Transfers and subsidies - capital (in-kind) | 2 029 | 80 345 | 3 099 | 113 | 5 567 |
| Surplus/(Deficit) after capital transfers & contributions | 31 314 | 121 958 | 124 166 | (162 013) | 99 528 |
| Share of surplus/(deficit) of associate | - | - | - | - | - |
| Surplus/(Deficit) for the year | 31 314 | 121 958 | 124 166 | (162 013) | 99 528 |
| CAPITAL EXPENDITURE & FUNDS SOURCES | |||||
| Capital expenditure | 635 308 | 597 946 | 398 315 | 422 209 | 471 573 |
| Transfers recognised - capital | 48 366 | 50 521 | 73 415 | 49 057 | 71 217 |
| Borrowing | 112 211 | 89 231 | 35 174 | 24 112 | 38 828 |
| Internally generated funds | 186 557 | 131 420 | 130 845 | 113 981 | 117 838 |
| Total sources of capital funds | 347 135 | 271 172 | 239 434 | 187 150 | 227 883 |
| FINANCIAL POSITION | |||||
| Total current assets | 813 175 | 815 944 | 835 880 | 757 299 | 713 754 |
| Total non current assets | 3 855 363 | 3 440 503 | 3 200 491 | 3 082 620 | 3 146 948 |
| Total current liabilities | 487 336 | 430 107 | 388 833 | 352 934 | 348 368 |
| Total non current liabilities | 597 000 | 474 932 | 422 890 | 390 883 | 346 281 |
| Community wealth/Equity | 3 552 888 | 3 229 451 | 3 100 483 | 3 258 115 | 3 066 524 |
| CASH FLOWS | |||||
| Net cash from (used) operating | 936 162 | 1 168 446 | 1 179 486 | 637 779 | 599 458 |
| Net cash from (used) investing | (368 998) | (293 332) | (154 943) | (129 290) | (47 219) |
| Net cash from (used) financing | - | - | (3 891) | (14 747) | - |
| Cash/cash equivalents at the year end | 1 147 880 | 1 488 838 | 1 608 736 | 1 047 298 | 1 313 403 |
| UNAUTHORISED, IRREGULAR, FRUITLESS & WASTEFUL EXPENDITURE | |||||
| Unauthorised expenditure | n/a | - | 2 155 | 237 079 | 14 869 |
| Irregular expenditure | n/a | 25 463 | 2 737 | 1 214 | 43 118 |
| Fruitless & wasteful expenditure | n/a | - | - | - | - |
| SOURCE | Audited Outcome A1 2026 Q1 | Audited Outcome A1 2026 Q1 | Audited Outcome A1 2026 Q1 | Audited Outcome A1 2024 | Audited Outcome A1 2023 |
Employment Statistics
| 2022/23 | 2021/22 | 2020/21 | 2019/20 | 2018/19 | |
| Employment | |||||
| Employment Costs (R’000) | 374 162 | 350 355 | 343 245 | 295 683 | 299 014 |
| Remuneration of councillors (R’000) | 13 414 | 12 806 | 11 812 | 11 899 | 11 483 |
| Total Employee Positions | 1 149 | 1 112 | 1 082 | 1 081 | 1 052 |
| Total Vacant Employee Positions | 74 | 54 | 6 | 6 | 59 |
| Total Vacancy Percentage | 6.44% | 4.86% | 0.55% | 0.56% | 5.61% |
| Managerial Positions – S54A and S56 | 7 | 7 | 7 | 7 | 7 |
| Vacant Managerial Positions – S54A and S56 | 1 | 1 | 0 | 1 | 0 |
| Managerial Positions - by organogram | 24 | 24 | 29 | 29 | 29 |
| Vacant Managerial Positions - by organogram | 0 | 0 | 6 | 5 | 2 |
Service Delivery Statistics
| 2022/23 | 2021/22 | 2020/21 | 2019/20 | 2018/19 | |
| Water | |||||
| Does the municipality provide? | Yes | Yes | Yes | Yes | Yes |
| Number of households and non-domestic customers to which provided | 42 643 | 42 154 | 41 207 | 40 762 | 39 998 |
| Number of domestic households/delivery points | 40 348 | 39 859 | 38 835 | 38 390 | 37 776 |
| Inside the yard | 40 348 | 39 859 | 38 835 | 38 390 | 37 776 |
| Less than 200m from yard | 0 | 0 | 0 | 0 | 0 |
| More than 200m from yard | 0 | 0 | 0 | 0 | 0 |
| Domestic households with access to free basic service | 10 267 | 6 423 | 7 863 | 7 657 | 26 771 |
| Electricity | |||||
| Does the municipality provide? | Yes | Yes | Yes | Yes | Yes |
| Number of households and non-domestic customers to which provided | 40 414 | 38 708 | 38 205 | 37 331 | 37 331 |
| Domestic households with access to free basic service | 13 337 | 9 092 | 9 747 | 9 644 | 10 874 |
| Sewerage and Sanitation | |||||
| Does the municipality provide? | Yes | Yes | Yes | Yes | Yes |
| Number of households and non-domestic customers to which provided | 42 915 | 41 528 | 40 135 | 39 515 | 38 385 |
| Number of households using: | |||||
| Flush toilet - public sewerage | 31 840 | 30 453 | 29 691 | 29 557 | 28 317 |
| Flush toilet - septic tank | 5 292 | 5 292 | 5 292 | 5 292 | 5 292 |
| Ventilated pit latrine | 0 | 0 | 0 | 4 | 4 |
| Bucket system | 159 | 159 | 126 | 126 | 126 |
| Other | 3 240 | 3 240 | 2 642 | 2 152 | 2 262 |
| Domestic households with access to free basic service | 9 949 | 5 945 | 7 189 | 7 123 | 10 508 |
| Solid Waste Services | |||||
| Does the municipality provide? | Yes | Yes | Yes | Yes | Yes |
| Number of households and non-domestic customers to which provided | 37 885 | 36 438 | 35 862 | 34 744 | 34 331 |
| Domestic households with access to free basic service | 10 368 | 6 447 | 7 800 | 7 588 | 11 256 |