 M
M
Municipalities
Mopani District Municipality (DC33)
Metropolitan, district, and local municipalities across South Africa.
DC33
Active
https://www.mopani.gov.za
Overview
Mopani District Municipality (DC33) is a Limpopo district authority that coordinates regional development planning and provides shared support across its local municipalities. It focuses on district-wide strategies, infrastructure coordination and capacity support where collaboration and scale improve delivery outcomes. The district also plays a convening role for cooperative governance, helping align municipal programmes with broader provincial and national priorities and strengthening resilience across the district area.
Geography, History & Economy
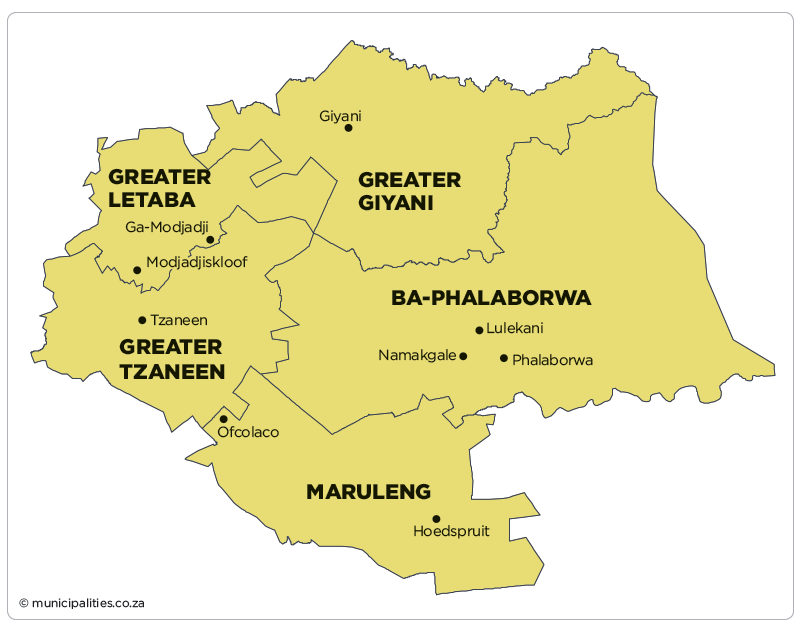
- Ba-Phalaborwa Local Municipality
- Greater Giyani Local Municipality
- Greater Letaba Local Municipality
- Greater Tzaneen Local Municipality
- Maruleng Local Municipality
Map
Council & Management
Composition of Council:
ANC 16, EFF 3, CIVIC WARRIORS 1, DA 1 (40% PR Seats)
Controlling Party:
n/a
Executive Mayor:
Mr Pule Josiah Shayi (ANC)
Speaker:
Mr TL Davhana (ANC)
Chief Whip:
Mr NJ Mukwevho
Other Council:
Ms TJ Bila (MMC: Economic Development)
Mr MG Chauke (MMC: Budget and Treasury)
Mr MA Mamedzi (MMC: Corporate Services)
Ms NR Mathukha (MMC: Community Services)
S Munyai (MMC: Planning and Development)
Ms SM Sinyosi (MMC: Water and Sanitation)
Municipal Manager:
Mr Tshepo Jack Mogano
Chief Financial Officer:
n/a
Senior Management:
Mr W Maluleke (GM: Technical Services)
Ms D Maputla (GM: Corporate Services)
M Mukoma (GM: Community Services)
Communications Officers:
Mr Odas Ngobeni (Deputy Manager: Communications)
Mr M Ralushai (Manager: Communication)
Mr Neil Shikwambana (Acting)
Demographic Information
| 2022 | 2016 | 2011 | |
| Population | 1 372 873 | 1 159 185 | 1 092 507 |
| Age Structure | |||
| Population under 15 | 33.2% | 31.5% | 33.8% |
| Population 15 to 64 | 60.4% | 63.9% | 60.5% |
| Population over 65 | 6.4% | 4.6% | 5.7% |
| Dependency Ratio | |||
| Per 100 (15-64) | 65.6 | 56.5 | 65.3 |
| Sex Ratio | |||
| Males per 100 females | 85.9 | 87.1 | 84.9 |
| Population Growth | |||
| Per annum | 2.22% | 1.35% | n/a |
| Labour Market | |||
| Unemployment rate (official) | n/a | n/a | 39.4% |
| Youth unemployment rate (official) 15-34 | n/a | n/a | 51.4% |
| Education (aged 20 +) | |||
| No schooling | 18.9% | 17.1% | 21.2% |
| Matric | n/a | 24.8% | 20.7% |
| Higher education | 8.2% | 8.1% | 7.9% |
| Household Dynamics | |||
| Households | 358 153 | 338 427 | 296 314 |
| Average household size | 3.8 | 3.4 | 3.7 |
| Female headed households | n/a | 49.2% | 50.9% |
| Formal dwellings | 95.7% | 90.7% | 92.2% |
| Housing owned | n/a | 71.5% | 55.6% |
| Household Services | |||
| Flush toilet connected to sewerage | 28.9% | 14.1% | 18.2% |
| Weekly refuse removal | 25.6% | 15.6% | 16.9% |
| Piped water inside dwelling | 27.6% | 12.8% | 16.8% |
| Electricity for lighting | 97.4% | 94.5% | 88.7% |
Financial Results
| All values: R'000 | 2024/25 | 2023/24 | 2022/23 | 2021/22 | 2020/21 |
| AUDIT OUTCOME | n/a | Qualified audit | Qualified audit | Disclaimer of audit | Disclaimer of audit |
| FINANCIAL PERFORMANCE | |||||
| Property rates | - | - | - | - | - |
| Service charges | 223 984 | 219 753 | 266 263 | 230 877 | 309 534 |
| Investment revenue | 29 904 | 28 439 | 11 463 | 3 622 | 6 479 |
| Transfers recognised - operational | 1 431 844 | 1 321 730 | 1 196 690 | 1 065 743 | 1 134 912 |
| Other own revenue | 176 706 | 127 210 | 116 280 | 81 383 | 232 023 |
| Total Revenue (excluding capital transfers and contributions) | 1 862 437 | 1 697 131 | 1 590 697 | 1 381 625 | 1 682 948 |
| Employee costs | 498 921 | 498 527 | 486 050 | 473 908 | 464 330 |
| Remuneration of councillors | 18 085 | 16 256 | 16 437 | 12 175 | 23 550 |
| Depreciation and amortisation | 295 131 | 321 688 | 255 771 | 234 334 | 202 187 |
| Finance charges | 18 942 | 73 831 | 50 877 | 52 436 | 38 145 |
| Inventory consumed and bulk purchases | 572 439 | 346 409 | 246 724 | 481 214 | 371 828 |
| Transfers and subsidies | - | - | - | - | - |
| Other expenditure | 1 469 049 | 745 120 | 781 413 | 389 759 | 387 371 |
| Total Expenditure | 2 872 565 | 2 001 831 | 1 837 273 | 1 643 826 | 1 487 410 |
| Surplus/(Deficit) | (1 010 128) | (304 700) | (246 576) | (262 201) | 195 538 |
| Transfers and subsidies - capital (monetary allocations) | 813 382 | 1 026 347 | 748 333 | 443 293 | 616 639 |
| Transfers and subsidies - capital (in-kind) | 1 749 | - | 59 | 520 | 3 798 |
| Surplus/(Deficit) after capital transfers & contributions | (194 997) | 721 647 | 501 815 | 181 611 | 815 975 |
| Share of surplus/(deficit) of associate | - | - | - | - | - |
| Surplus/(Deficit) for the year | (194 997) | 721 647 | 501 815 | 181 611 | 815 975 |
| CAPITAL EXPENDITURE & FUNDS SOURCES | |||||
| Capital expenditure | 625 927 | 906 943 | 638 697 | 469 701 | 958 379 |
| Transfers recognised - capital | (224 480) | 786 649 | 555 160 | 397 045 | 821 748 |
| Borrowing | - | - | - | - | - |
| Internally generated funds | 850 407 | 120 294 | 78 333 | 124 261 | 125 266 |
| Total sources of capital funds | 625 927 | 906 943 | 633 493 | 521 306 | 947 013 |
| FINANCIAL POSITION | |||||
| Total current assets | 3 798 320 | 452 619 | 2 497 087 | 2 082 904 | 1 805 874 |
| Total non current assets | 10 116 300 | 9 600 076 | 8 929 576 | 8 551 928 | 6 328 030 |
| Total current liabilities | 1 761 389 | 1 818 854 | 4 106 724 | 3 674 848 | 2 614 035 |
| Total non current liabilities | 1 900 841 | 193 483 | 1 229 | (39 547) | 43 646 |
| Community wealth/Equity | 10 247 809 | 8 014 093 | 7 318 711 | 7 042 649 | 5 482 664 |
| CASH FLOWS | |||||
| Net cash from (used) operating | 317 248 | 1 299 535 | 1 271 622 | 1 050 613 | 1 637 121 |
| Net cash from (used) investing | (760 472) | (440 590) | (607 644) | (551 961) | (689 882) |
| Net cash from (used) financing | - | - | - | - | - |
| Cash/cash equivalents at the year end | (262 485) | 877 422 | 691 528 | 630 257 | 1 203 605 |
| UNAUTHORISED, IRREGULAR, FRUITLESS & WASTEFUL EXPENDITURE | |||||
| Unauthorised expenditure | n/a | 422 689 | 588 658 | 1 394 612 | 80 584 |
| Irregular expenditure | n/a | 7 662 | 164 949 | 301 692 | 300 278 |
| Fruitless & wasteful expenditure | n/a | 63 731 | 78 882 | 455 838 | 43 710 |
| SOURCE | Audited Outcome A1 2026 Q1 | Audited Outcome A1 2026 Q1 | Audited Outcome A1 2026 Q1 | Audited Outcome A1 2024 | Audited Outcome A1 2023 |
Employment Statistics
| 2022/23 | 2021/22 | 2020/21 | 2019/20 | 2018/19 | |
| Employment | |||||
| Employment Costs (R’000) | 486 050 | 473 908 | 464 330 | 426 811 | 389 571 |
| Remuneration of councillors (R’000) | 16 437 | 12 175 | 23 550 | 33 624 | 13 224 |
| Total Employee Positions | 38 | 652 | 661 | 611 | 1 121 |
| Total Vacant Employee Positions | 2 | 5 | 0 | 2 | 455 |
| Total Vacancy Percentage | 5.26% | 0.77% | 0.00% | 0.33% | 40.59% |
| Managerial Positions – S54A and S56 | 7 | 7 | 7 | 7 | 7 |
| Vacant Managerial Positions – S54A and S56 | 0 | 2 | 0 | 2 | 0 |
| Managerial Positions - by organogram | 31 | 31 | 31 | 31 | 31 |
| Vacant Managerial Positions - by organogram | 2 | 2 | 0 | 0 | 0 |
Service Delivery Statistics
| 2022/23 | 2021/22 | 2020/21 | 2019/20 | 2018/19 | |
| Water | |||||
| Does the municipality provide? | Yes | Yes | Yes | Yes | Yes |
| Number of households and non-domestic customers to which provided | 305 952 | 296 320 | 296 320 | 296 320 | 293 601 |
| Number of domestic households/delivery points | 305 952 | 296 320 | 296 320 | 296 320 | 293 601 |
| Inside the yard | 162 838 | 153 206 | 153 206 | 153 206 | 153 206 |
| Less than 200m from yard | 113 850 | 113 850 | 113 850 | 113 850 | 106 622 |
| More than 200m from yard | 29 264 | 29 264 | 29 264 | 29 264 | 33 773 |
| Domestic households with access to free basic service | 37 447 | 37 447 | 37 447 | 37 447 | 37 447 |
| Electricity | |||||
| Does the municipality provide? | No | No | No | No | No |
| Number of households and non-domestic customers to which provided | 0 | 0 | 0 | 0 | 0 |
| Domestic households with access to free basic service | 0 | 0 | 0 | 0 | 0 |
| Sewerage and Sanitation | |||||
| Does the municipality provide? | Yes | Yes | Yes | Yes | Yes |
| Number of households and non-domestic customers to which provided | 257 826 | 257 353 | 257 353 | 256 263 | 249 555 |
| Number of households using: | |||||
| Flush toilet - public sewerage | 57 589 | 57 116 | 57 116 | 57 116 | 57 116 |
| Flush toilet - septic tank | 8 205 | 8 205 | 8 205 | 7 115 | 7 115 |
| Ventilated pit latrine | 192 032 | 192 032 | 192 032 | 192 032 | 185 324 |
| Bucket system | 0 | 0 | 0 | 0 | 0 |
| Other | 0 | 0 | 0 | 0 | 0 |
| Domestic households with access to free basic service | 5 359 | 5 359 | 5 359 | 5 389 | 5 389 |
| Solid Waste Services | |||||
| Does the municipality provide? | No | No | No | No | No |
| Number of households and non-domestic customers to which provided | 0 | 0 | 0 | 0 | 0 |
| Domestic households with access to free basic service | 0 | 0 | 0 | 0 | 0 |