 M
M
Municipalities
Molemole Local Municipality (LIM353)
Metropolitan, district, and local municipalities across South Africa.
LIM353
Active
https://www.molemole.gov.za
Overview
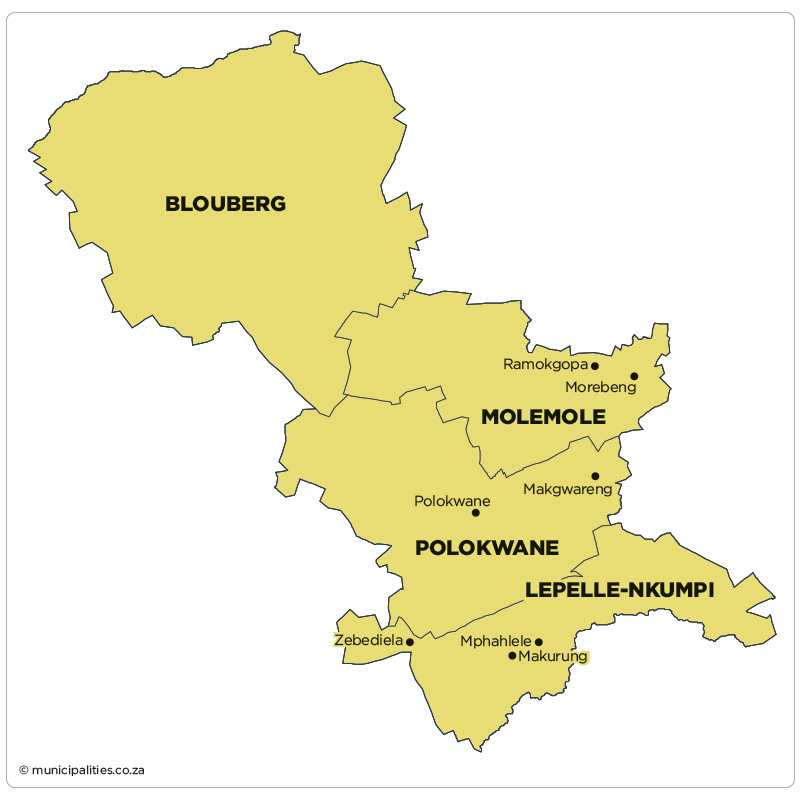
Molemole Local Municipality (LIM353) is a Limpopo local authority responsible for municipal governance, service delivery and development planning. It oversees municipal administration, supports the maintenance of municipal infrastructure and public facilities, and applies by-laws and compliance functions that support orderly development. Through the IDP and annual budgets, the municipality prioritises reliable basic services, asset maintenance and projects that respond to local needs.
Map
Council & Management
Composition of Council:
ANC 22, EFF 6, CICAF 2, CIVIC WARRIORS 1, DA 1
Controlling Party:
ANC
Mayor:
Mr Edward Paya (ANC)
Speaker:
Ms Dikeledi Matlou (ANC)
Chief Whip:
Mr Masilo Rathaha
Other Council:
Ms Boitumelo Hlapa (Chairperson: Finance)
Mr Shobane Mafona (Chairperson: LEDP)
Mrs ML Moabelo (Chairperson: Corporate Services)
Mr Oscar Motolla (Chairperson: Community Services)
Municipal Manager:
Mr KE Makgatho
Chief Financial Officer:
Ms Khanyisile Wendy Zulu
Senior Management:
Ms Tiyani Mahatlani (Planning and Economic Development)
Mr Thimothy Molopa (Acting: Community Services)
Communications Officers:
Ms Maseforo Mathatho
Demographic Information
| 2022 | 2016 | 2011 | |
| Population | 127 130 | 125 327 | 126 506 |
| Age Structure | |||
| Population under 15 | 31.6% | 37.3% | 36.0% |
| Population 15 to 64 | 59.8% | 55.4% | 56.0% |
| Population over 65 | 8.6% | 7.3% | 7.9% |
| Dependency Ratio | |||
| Per 100 (15-64) | 67.3 | 80.6 | 78.4 |
| Sex Ratio | |||
| Males per 100 females | 87.0 | 82.5 | 84.8 |
| Population Growth | |||
| Per annum | 0.05% | -0.21% | n/a |
| Labour Market | |||
| Unemployment rate (official) | n/a | n/a | n/a |
| Youth unemployment rate (official) 15-34 | n/a | n/a | n/a |
| Education (aged 20 +) | |||
| No schooling | 17.0% | 20.2% | 19.6% |
| Matric | n/a | 21.5% | 18.6% |
| Higher education | 9.1% | 9.0% | 8.1% |
| Household Dynamics | |||
| Households | 41 939 | 34 133 | 34 673 |
| Average household size | 3.0 | 3.7 | 3.6 |
| Female headed households | n/a | 54.8% | 53.5% |
| Formal dwellings | 96.7% | 96.1% | 96.1% |
| Housing owned | n/a | 77.7% | 59.7% |
| Household Services | |||
| Flush toilet connected to sewerage | 32.9% | 11.7% | 13.5% |
| Weekly refuse removal | 23.9% | 4.4% | 5.0% |
| Piped water inside dwelling | 29.1% | 5.6% | 8.6% |
| Electricity for lighting | 96.5% | 97.3% | 95.7% |
Financial Results
| All values: R'000 | 2024/25 | 2023/24 | 2022/23 | 2021/22 | 2020/21 |
| AUDIT OUTCOME | n/a | Financially unqualified | Financially unqualified | Financially unqualified | Financially unqualified |
| FINANCIAL PERFORMANCE | |||||
| Property rates | 29 864 | 28 785 | 32 724 | 30 599 | 49 558 |
| Service charges | 13 302 | 13 271 | 11 423 | 10 948 | 11 062 |
| Investment revenue | 13 919 | 12 651 | 8 168 | 4 709 | 2 544 |
| Transfers recognised - operational | 193 141 | 222 032 | 174 739 | 160 911 | 185 288 |
| Other own revenue | 25 989 | 8 701 | 7 714 | 8 583 | 7 826 |
| Total Revenue (excluding capital transfers and contributions) | 276 215 | 285 440 | 234 767 | 215 750 | 256 278 |
| Employee costs | 118 552 | 113 533 | 101 438 | 96 156 | 91 655 |
| Remuneration of councillors | 14 186 | 13 823 | 13 651 | 12 948 | 12 930 |
| Depreciation and amortisation | 24 412 | 19 795 | 18 587 | 19 095 | 12 115 |
| Finance charges | 2 936 | 2 070 | 2 468 | 14 | 184 |
| Inventory consumed and bulk purchases | 21 254 | 19 740 | 19 077 | 19 211 | 14 947 |
| Transfers and subsidies | - | - | - | - | - |
| Other expenditure | 127 655 | 105 073 | 86 322 | 79 349 | 89 243 |
| Total Expenditure | 308 994 | 274 034 | 241 542 | 226 772 | 221 074 |
| Surplus/(Deficit) | (32 779) | 11 406 | (6 775) | (11 023) | 35 204 |
| Transfers and subsidies - capital (monetary allocations) | 37 449 | 44 802 | 40 347 | 43 525 | 45 028 |
| Transfers and subsidies - capital (in-kind) | - | - | 1 894 | - | 1 235 |
| Surplus/(Deficit) after capital transfers & contributions | 4 669 | 56 208 | 35 466 | 32 502 | 81 467 |
| Share of surplus/(deficit) of associate | - | - | - | - | - |
| Surplus/(Deficit) for the year | 4 669 | 56 208 | 35 466 | 32 502 | 81 467 |
| CAPITAL EXPENDITURE & FUNDS SOURCES | |||||
| Capital expenditure | 52 823 | 65 335 | 52 855 | 48 687 | 50 057 |
| Transfers recognised - capital | 32 564 | 57 255 | 35 522 | 38 040 | 40 290 |
| Borrowing | - | - | - | - | - |
| Internally generated funds | 20 259 | 8 080 | 15 439 | 10 647 | 9 767 |
| Total sources of capital funds | 52 823 | 65 335 | 50 961 | 48 687 | 50 057 |
| FINANCIAL POSITION | |||||
| Total current assets | 94 114 | 127 045 | 174 132 | 172 225 | 169 579 |
| Total non current assets | 458 764 | 421 458 | 359 732 | 337 114 | 305 416 |
| Total current liabilities | (5 670) | 5 679 | 14 163 | 26 948 | 36 076 |
| Total non current liabilities | 59 791 | 51 960 | 44 978 | 27 271 | 26 098 |
| Community wealth/Equity | 553 730 | 497 040 | 474 612 | 455 120 | 412 821 |
| CASH FLOWS | |||||
| Net cash from (used) operating | 29 003 | 278 876 | 201 682 | 159 607 | 60 566 |
| Net cash from (used) investing | (52 053) | (65 333) | (52 855) | (48 687) | (28 733) |
| Net cash from (used) financing | - | - | - | - | - |
| Cash/cash equivalents at the year end | 117 292 | 225 804 | 254 106 | 200 466 | 54 844 |
| UNAUTHORISED, IRREGULAR, FRUITLESS & WASTEFUL EXPENDITURE | |||||
| Unauthorised expenditure | n/a | 18 205 | 11 076 | - | - |
| Irregular expenditure | n/a | - | 4 035 | 2 477 | 2 303 |
| Fruitless & wasteful expenditure | n/a | - | 2 | - | 28 |
| SOURCE | Audited Outcome A1 2026 Q1 | Audited Outcome A1 2026 Q1 | Audited Outcome A1 2026 Q1 | Audited Outcome A1 2024 | Audited Outcome A1 2023 |
Employment Statistics
| 2022/23 | 2021/22 | 2020/21 | 2019/20 | 2018/19 | |
| Employment | |||||
| Employment Costs (R’000) | 101 438 | 96 156 | 91 655 | 84 280 | 78 989 |
| Remuneration of councillors (R’000) | 13 651 | 12 948 | 12 930 | 12 880 | 12 328 |
| Total Employee Positions | 192 | 202 | 199 | 170 | 171 |
| Total Vacant Employee Positions | 24 | 24 | 1 | 0 | 2 |
| Total Vacancy Percentage | 12.50% | 11.88% | 0.50% | 0.00% | 1.17% |
| Managerial Positions – S54A and S56 | 6 | 6 | 6 | 6 | 5 |
| Vacant Managerial Positions – S54A and S56 | 3 | 1 | 1 | 0 | 0 |
| Managerial Positions - by organogram | 20 | 20 | 9 | 8 | 8 |
| Vacant Managerial Positions - by organogram | 1 | 11 | 0 | 0 | 0 |
Service Delivery Statistics
| 2022/23 | 2021/22 | 2020/21 | 2019/20 | 2018/19 | |
| Water | |||||
| Does the municipality provide? | No | No | No | No | No |
| Number of households and non-domestic customers to which provided | 0 | 0 | 0 | 0 | 0 |
| Number of domestic households/delivery points | 0 | 0 | 0 | 0 | 0 |
| Inside the yard | 0 | 0 | 0 | 0 | 0 |
| Less than 200m from yard | 0 | 0 | 0 | 0 | 0 |
| More than 200m from yard | 0 | 0 | 0 | 0 | 0 |
| Domestic households with access to free basic service | 0 | 0 | 0 | 0 | 0 |
| Electricity | |||||
| Does the municipality provide? | Yes | Yes | Yes | Yes | Yes |
| Number of households and non-domestic customers to which provided | 34 005 | 34 005 | 33 605 | 33 605 | 33 605 |
| Domestic households with access to free basic service | 2 016 | 5 882 | 5 882 | 5 313 | 4 576 |
| Sewerage and Sanitation | |||||
| Does the municipality provide? | No | No | No | No | No |
| Number of households and non-domestic customers to which provided | 0 | 0 | 0 | 0 | 0 |
| Number of households using: | |||||
| Flush toilet - public sewerage | 0 | 0 | 0 | 0 | 0 |
| Flush toilet - septic tank | 0 | 0 | 0 | 0 | 0 |
| Ventilated pit latrine | 0 | 0 | 0 | 0 | 0 |
| Bucket system | 0 | 0 | 0 | 0 | 0 |
| Other | 0 | 0 | 0 | 0 | 0 |
| Domestic households with access to free basic service | 0 | 0 | 0 | 0 | 0 |
| Solid Waste Services | |||||
| Does the municipality provide? | Yes | Yes | Yes | Yes | Yes |
| Number of households and non-domestic customers to which provided | 2 665 | 2 665 | 2 665 | 2 664 | 2 664 |
| Domestic households with access to free basic service | 153 | 153 | 153 | 153 | 66 |