 M
M
Municipalities
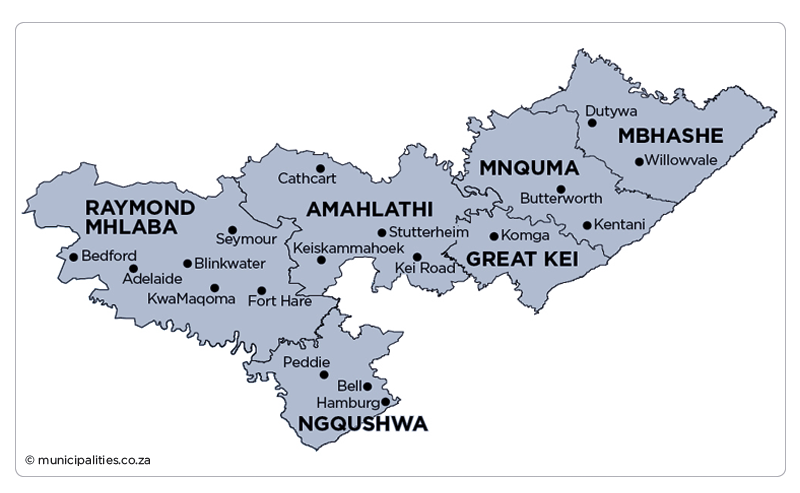
Mbhashe Local Municipality (EC121)
Metropolitan, district, and local municipalities across South Africa.
EC121
Active
https://www.mbhashemun.gov.za
Overview
Mbhashe Local Municipality (EC121) is an Eastern Cape local authority tasked with delivering municipal services and managing local governance for its communities. It oversees municipal administration, local infrastructure and public facilities, and it runs planning and budgeting processes that determine priorities for service improvements and development projects. Through ward participation and public engagement, the municipality focuses on expanding access to basic services, maintaining assets and supporting local development.
Map
Council & Management
Composition of Council:
ANC 45, UDM 8, EFF 4, ATA 1, ATM 1, BPM 1, DA 1, INDEPENDENT 1, PAC 1
Controlling Party:
ANC
Mayor:
Mr Samkelo Nicholas Janda (ANC)
Deputy Mayor:
n/a
Speaker:
Ms Babalwa Majavu (ANC)
Chief Whip:
Mr Ludwe Mantshiyose
Other Council:
Ms Nombongo Apleni (Portfolio Head: Budget and Treasury Office)
Ms Nolundi Gxamtwana (Portfolio Head: Community Services)
Ms Mirriam Kungeka Makapela (Portfolio Head: Infrastructure)
Ms Nomvuyiseko Mgedezi (Portfolio Head: Developmental Planning)
Ms Fikiswa Ndaule (Portfolio Head: Good Governance and Public Participation)
Ms Nolumanyano Ngomthi (Portfolio Head: Corporate Services)
Municipal Manager:
Mr Mkhululi Nako
Chief Financial Officer:
Mr Vuyo Jam Jam
Senior Management:
Mr Sikhusele Cobokana (Developmental Planning)
Ms Nonurse Mlungu (Community Services)
Ms Misiwe Mpahlwa (Operations)
Mr Zukile Msipha (Infrastructure Services)
Ms Ntombizodwa Nkuhlu (Corporate Services)
Communications Officers:
Ms Babalwa Magqwanti (Communications Manager/Spokesperson)
Demographic Information
| 2022 | 2016 | 2011 | |
| Population | 240 020 | 277 250 | 261 670 |
| Age Structure | |||
| Population under 15 | 33.4% | 35.8% | 38.0% |
| Population 15 to 64 | 57.1% | 59.0% | 53.8% |
| Population over 65 | 9.6% | 5.2% | 8.2% |
| Dependency Ratio | |||
| Per 100 (15-64) | 75.3 | 69.6 | 85.8 |
| Sex Ratio | |||
| Males per 100 females | 86.2 | 86.3 | 85.0 |
| Population Growth | |||
| Per annum | -0.84% | 1.31% | n/a |
| Labour Market | |||
| Unemployment rate (official) | n/a | n/a | n/a |
| Youth unemployment rate (official) 15-34 | n/a | n/a | n/a |
| Education (aged 20 +) | |||
| No schooling | 16.0% | 15.6% | 21.4% |
| Matric | n/a | 13.7% | 10.0% |
| Higher education | 5.6% | 4.5% | 4.9% |
| Household Dynamics | |||
| Households | 52 715 | 58 727 | 61 893 |
| Average household size | 4.6 | 4.7 | 4.2 |
| Female headed households | n/a | 57.1% | 58.3% |
| Formal dwellings | 69.2% | 41.1% | 30.6% |
| Housing owned | n/a | 68.3% | 73.3% |
| Household Services | |||
| Flush toilet connected to sewerage | 26.5% | 3.0% | 4.4% |
| Weekly refuse removal | 26.8% | 10.9% | 3.0% |
| Piped water inside dwelling | 26.7% | 3.3% | 3.4% |
| Electricity for lighting | 90.5% | 66.8% | 49.7% |
Financial Results
| All values: R'000 | 2024/25 | 2023/24 | 2022/23 | 2021/22 | 2020/21 |
| AUDIT OUTCOME | n/a | Financially unqualified | Financially unqualified | Financially unqualified | Financially unqualified |
| FINANCIAL PERFORMANCE | |||||
| Property rates | 21 099 | 20 432 | 19 991 | 16 242 | 11 637 |
| Service charges | 3 894 | 3 730 | 3 491 | 2 638 | 3 491 |
| Investment revenue | 45 354 | 40 172 | 26 198 | 11 615 | 5 717 |
| Transfers recognised - operational | 382 941 | 363 246 | 328 241 | 281 001 | 332 729 |
| Other own revenue | 16 606 | 13 513 | 10 293 | 11 675 | 10 554 |
| Total Revenue (excluding capital transfers and contributions) | 469 893 | 441 094 | 388 214 | 323 171 | 364 129 |
| Employee costs | 149 248 | 139 164 | 126 011 | 131 226 | 141 540 |
| Remuneration of councillors | 24 076 | 23 227 | 23 492 | 13 195 | 7 449 |
| Depreciation and amortisation | 67 765 | 56 688 | 57 733 | 64 937 | 55 743 |
| Finance charges | 18 | 21 | 9 | 82 | 205 |
| Inventory consumed and bulk purchases | - | - | 1 | (162) | 143 |
| Transfers and subsidies | - | - | - | 5 | - |
| Other expenditure | 164 298 | 183 931 | 136 629 | 104 067 | 105 665 |
| Total Expenditure | 405 405 | 403 032 | 343 874 | 313 350 | 310 745 |
| Surplus/(Deficit) | 64 488 | 38 062 | 44 339 | 9 821 | 53 384 |
| Transfers and subsidies - capital (monetary allocations) | 79 344 | 85 236 | 103 225 | 48 151 | 58 065 |
| Transfers and subsidies - capital (in-kind) | - | - | - | - | - |
| Surplus/(Deficit) after capital transfers & contributions | 143 833 | 123 298 | 147 564 | 57 972 | 111 449 |
| Share of surplus/(deficit) of associate | - | - | - | - | - |
| Surplus/(Deficit) for the year | 143 833 | 123 298 | 147 564 | 57 972 | 111 449 |
| CAPITAL EXPENDITURE & FUNDS SOURCES | |||||
| Capital expenditure | 1 390 630 | 1 312 647 | 1 207 376 | 1 116 275 | 1 072 988 |
| Transfers recognised - capital | 109 789 | 134 265 | 100 385 | 37 103 | 47 012 |
| Borrowing | - | - | - | - | - |
| Internally generated funds | 1 279 700 | 1 176 463 | 1 106 991 | 1 079 032 | 44 775 |
| Total sources of capital funds | 1 389 488 | 1 310 729 | 1 207 376 | 1 116 135 | 91 787 |
| FINANCIAL POSITION | |||||
| Total current assets | 499 411 | 422 582 | 324 675 | 183 449 | 232 857 |
| Total non current assets | 762 157 | 696 755 | 668 819 | 656 108 | 664 862 |
| Total current liabilities | 19 661 | 21 211 | 11 203 | 4 733 | 108 142 |
| Total non current liabilities | - | - | - | - | - |
| Community wealth/Equity | 1 098 074 | 974 829 | 834 728 | 776 852 | 566 679 |
| CASH FLOWS | |||||
| Net cash from (used) operating | 50 629 | 39 280 | 31 248 | 44 670 | 10 280 |
| Net cash from (used) investing | 55 | - | - | - | - |
| Net cash from (used) financing | - | - | - | - | - |
| Cash/cash equivalents at the year end | 72 124 | 60 677 | 52 644 | 44 668 | 10 278 |
| UNAUTHORISED, IRREGULAR, FRUITLESS & WASTEFUL EXPENDITURE | |||||
| Unauthorised expenditure | n/a | - | - | - | - |
| Irregular expenditure | n/a | 2 332 | 12 796 | 6 043 | 21 120 |
| Fruitless & wasteful expenditure | n/a | 240 | 9 | 10 995 | 205 |
| SOURCE | Audited Outcome A1 2026 Q1 | Audited Outcome A1 2026 Q1 | Audited Outcome A1 2026 Q1 | Audited Outcome A1 2024 | Audited Outcome A1 2023 |
Employment Statistics
| 2022/23 | 2021/22 | 2020/21 | 2019/20 | 2018/19 | |
| Employment | |||||
| Employment Costs (R’000) | 126 011 | 131 226 | 141 540 | 150 710 | 132 963 |
| Remuneration of councillors (R’000) | 23 492 | 13 195 | 7 449 | - | - |
| Total Employee Positions | 285 | 261 | 289 | 282 | 311 |
| Total Vacant Employee Positions | 2 | 1 | 1 | 2 | 21 |
| Total Vacancy Percentage | 0.70% | 0.38% | 0.35% | 0.71% | 6.75% |
| Managerial Positions – S54A and S56 | 7 | 7 | 7 | 7 | 7 |
| Vacant Managerial Positions – S54A and S56 | 0 | 0 | 0 | 0 | 1 |
| Managerial Positions - by organogram | 17 | 17 | 16 | 16 | 16 |
| Vacant Managerial Positions - by organogram | 2 | 0 | 1 | 2 | 1 |
Service Delivery Statistics
| 2022/23 | 2021/22 | 2020/21 | 2019/20 | 2018/19 | |
| Water | |||||
| Does the municipality provide? | No | No | No | No | No |
| Number of households and non-domestic customers to which provided | 0 | 0 | 0 | 0 | 0 |
| Number of domestic households/delivery points | 0 | 0 | 0 | 0 | 0 |
| Inside the yard | 0 | 0 | 0 | 0 | 0 |
| Less than 200m from yard | 0 | 0 | 0 | 0 | 0 |
| More than 200m from yard | 0 | 0 | 0 | 0 | 0 |
| Domestic households with access to free basic service | 0 | 0 | 0 | 0 | 0 |
| Electricity | |||||
| Does the municipality provide? | No | No | No | No | No |
| Number of households and non-domestic customers to which provided | 46 475 | 46 167 | 45 967 | 45 967 | 45 281 |
| Domestic households with access to free basic service | 1 710 | 4 789 | 4 789 | 4 789 | 4 773 |
| Sewerage and Sanitation | |||||
| Does the municipality provide? | No | No | No | No | No |
| Number of households and non-domestic customers to which provided | 0 | 0 | 0 | 0 | 0 |
| Number of households using: | |||||
| Flush toilet - public sewerage | 0 | 0 | 0 | 0 | 0 |
| Flush toilet - septic tank | 0 | 0 | 0 | 0 | 0 |
| Ventilated pit latrine | 0 | 0 | 0 | 0 | 0 |
| Bucket system | 0 | 0 | 0 | 0 | 0 |
| Other | 0 | 0 | 0 | 0 | 0 |
| Domestic households with access to free basic service | 0 | 0 | 0 | 0 | 0 |
| Solid Waste Services | |||||
| Does the municipality provide? | Yes | Yes | Yes | Yes | Yes |
| Number of households and non-domestic customers to which provided | 60 124 | 60 124 | 60 124 | 60 124 | 60 124 |
| Domestic households with access to free basic service | 4 789 | 4 789 | 4 789 | 4 789 | 4 773 |