 M
M
Municipalities
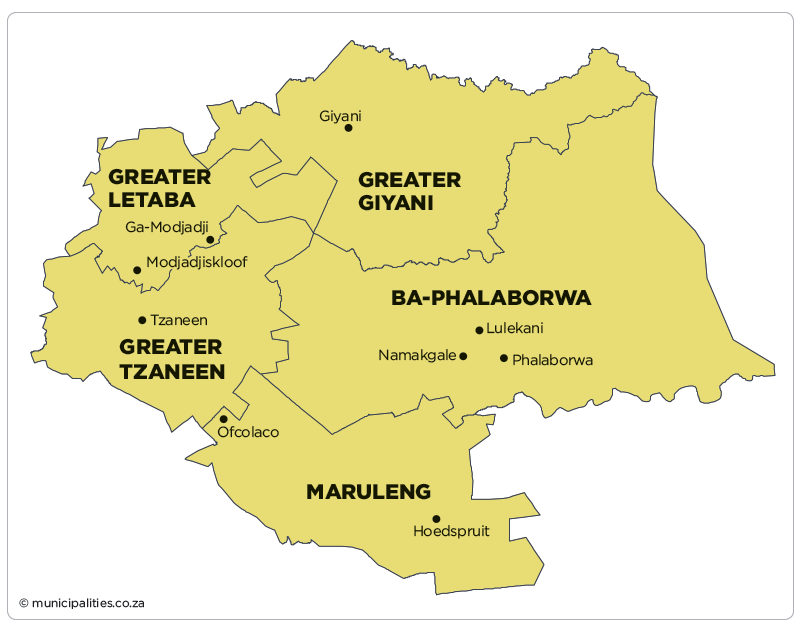
Maruleng Local Municipality (LIM335)
Metropolitan, district, and local municipalities across South Africa.
LIM335
Active
https://www.maruleng.gov.za
Overview
Maruleng Local Municipality (LIM335) provides municipal governance and services within its Limpopo jurisdiction. It manages local administration, maintains municipal infrastructure and community facilities, and implements planning and compliance functions that support service delivery and orderly development. Using the IDP, spatial planning instruments and annual budgets, the municipality prioritises essential services, maintenance programmes and development projects that strengthen community wellbeing and local opportunity.
Map
Council & Management
Composition of Council:
ANC 15, EFF 4, CIVIC WARRIORS 3, DA 2, INDEPENDENT 2, VF PLUS 1
Controlling Party:
ANC
Mayor:
Mr Tsheko Calais Musolwa (ANC)
Speaker:
Ms Raganya Blantina (ANC)
Chief Whip:
Ms Thobejane Happy Mafura
Other Council:
Mr R Bishop (Chairperson: MPAC)
Mr MR Maakamela (Chairperson: Ethics)
Mr Toona Alfred Mathaba (Chairperson: Sports and Culture)
Ms MA Mathaba (Chairperson: Finance and Corporate Services)
Ms MM Shai (Chairperson: Community Services)
Mr MT Tshetlha (Chairperson: Infrastructure and SPED)
Municipal Manager:
Ms Nanki Sedibaneng Hoaeane
Chief Financial Officer:
Mr Sebelebele Tlou Herman
Senior Management:
Mr Morwa Lesley Muroa (Director: Technical Services)
Ms H Phasha (Director: Community Services)
Dr Setimela Sampson Sebashe (Director: Corporate Services)
Communications Officers:
Mr Sodi Magomane
Ms Paulina Tlaisego Mohlala
Demographic Information
| 2022 | 2016 | 2011 | |
| Population | 128 137 | 99 946 | 95 328 |
| Age Structure | |||
| Population under 15 | 32.7% | 31.7% | 34.3% |
| Population 15 to 64 | 60.9% | 64.2% | 60.4% |
| Population over 65 | 6.5% | 4.1% | 5.3% |
| Dependency Ratio | |||
| Per 100 (15-64) | 64.3 | 55.7 | 65.4 |
| Sex Ratio | |||
| Males per 100 females | 86.6 | 85.9 | 85.1 |
| Population Growth | |||
| Per annum | 2.87% | 1.08% | n/a |
| Labour Market | |||
| Unemployment rate (official) | n/a | n/a | n/a |
| Youth unemployment rate (official) 15-34 | n/a | n/a | n/a |
| Education (aged 20 +) | |||
| No schooling | 17.5% | 13.3% | 20.9% |
| Matric | n/a | 20.9% | 18.3% |
| Higher education | 8.7% | 10.0% | 6.8% |
| Household Dynamics | |||
| Households | 31 968 | 29 007 | 24 689 |
| Average household size | 4.0 | 3.4 | 3.9 |
| Female headed households | n/a | 50.5% | 53.5% |
| Formal dwellings | 96.9% | 95.2% | 96.0% |
| Housing owned | n/a | 51.2% | 24.5% |
| Household Services | |||
| Flush toilet connected to sewerage | 26.5% | 3.4% | 12.8% |
| Weekly refuse removal | 21.7% | 5.2% | 5.8% |
| Piped water inside dwelling | 30.4% | 10.8% | 11.1% |
| Electricity for lighting | 96.3% | 95.1% | 90.6% |
Financial Results
| All values: R'000 | 2024/25 | 2023/24 | 2022/23 | 2021/22 | 2020/21 |
| AUDIT OUTCOME | n/a | Financially unqualified | Financially unqualified | Financially unqualified | Financially unqualified |
| FINANCIAL PERFORMANCE | |||||
| Property rates | 186 026 | 172 692 | 126 697 | 117 430 | 108 873 |
| Service charges | 5 707 | 5 386 | 4 923 | 4 367 | 4 015 |
| Investment revenue | 12 257 | 11 055 | 8 337 | 4 409 | 4 163 |
| Transfers recognised - operational | 187 658 | 169 349 | 158 022 | 142 768 | 162 391 |
| Other own revenue | 32 550 | 31 756 | 26 274 | 24 519 | 23 898 |
| Total Revenue (excluding capital transfers and contributions) | 424 198 | 390 238 | 324 253 | 293 493 | 303 340 |
| Employee costs | 101 171 | 93 338 | 85 861 | 79 163 | 75 972 |
| Remuneration of councillors | 12 518 | 12 298 | 11 820 | 11 097 | 11 120 |
| Depreciation and amortisation | 33 008 | 27 447 | 27 692 | 25 462 | 21 954 |
| Finance charges | 2 436 | 1 919 | 1 429 | 1 021 | 744 |
| Inventory consumed and bulk purchases | 5 474 | 4 712 | 5 426 | 4 211 | 4 845 |
| Transfers and subsidies | 59 754 | 102 198 | - | - | - |
| Other expenditure | 202 398 | 147 760 | 119 020 | 92 499 | 103 583 |
| Total Expenditure | 416 760 | 389 671 | 251 248 | 213 453 | 218 217 |
| Surplus/(Deficit) | 7 438 | 567 | 73 005 | 80 041 | 85 123 |
| Transfers and subsidies - capital (monetary allocations) | 66 232 | 78 519 | 73 822 | 33 659 | 46 296 |
| Transfers and subsidies - capital (in-kind) | - | - | 7 357 | 18 562 | - |
| Surplus/(Deficit) after capital transfers & contributions | 73 670 | 79 085 | 154 183 | 132 262 | 131 419 |
| Share of surplus/(deficit) of associate | - | - | - | - | - |
| Surplus/(Deficit) for the year | 73 670 | 79 085 | 154 183 | 132 262 | 131 419 |
| CAPITAL EXPENDITURE & FUNDS SOURCES | |||||
| Capital expenditure | 239 705 | 173 017 | 267 411 | 271 012 | 130 100 |
| Transfers recognised - capital | 2 515 | 39 964 | 57 045 | 36 298 | 34 796 |
| Borrowing | - | - | - | - | - |
| Internally generated funds | 121 819 | 113 546 | 161 315 | 174 850 | 104 743 |
| Total sources of capital funds | 124 334 | 153 509 | 218 360 | 211 149 | 139 539 |
| FINANCIAL POSITION | |||||
| Total current assets | 533 423 | 492 827 | 420 075 | 383 075 | 342 783 |
| Total non current assets | 955 668 | 859 073 | 960 918 | 809 078 | 655 589 |
| Total current liabilities | 409 850 | 347 874 | 282 649 | 254 894 | 190 218 |
| Total non current liabilities | 7 736 | 6 513 | 5 502 | 1 908 | 1 061 |
| Community wealth/Equity | 1 071 504 | 997 514 | 1 092 808 | 935 812 | 807 093 |
| CASH FLOWS | |||||
| Net cash from (used) operating | 215 071 | 237 375 | 237 659 | 536 421 | 400 342 |
| Net cash from (used) investing | (211 587) | (211 057) | (163 136) | (140 379) | (138 300) |
| Net cash from (used) financing | - | - | 823 | 667 | - |
| Cash/cash equivalents at the year end | 174 123 | 176 742 | 230 094 | 520 607 | 335 890 |
| UNAUTHORISED, IRREGULAR, FRUITLESS & WASTEFUL EXPENDITURE | |||||
| Unauthorised expenditure | n/a | 14 101 | 4 364 | 35 144 | 20 914 |
| Irregular expenditure | n/a | 13 284 | 37 827 | 80 124 | 52 330 |
| Fruitless & wasteful expenditure | n/a | 20 | 120 | 3 819 | 193 |
| SOURCE | Audited Outcome A1 2026 Q1 | Audited Outcome A1 2026 Q1 | Audited Outcome A1 2026 Q1 | Audited Outcome A1 2024 | Audited Outcome A1 2023 |
Employment Statistics
| 2022/23 | 2021/22 | 2020/21 | 2019/20 | 2018/19 | |
| Employment | |||||
| Employment Costs (R’000) | 85 861 | 79 163 | 75 972 | 63 265 | 68 732 |
| Remuneration of councillors (R’000) | 11 820 | 11 097 | 11 120 | 11 101 | 10 573 |
| Total Employee Positions | 214 | 258 | 203 | 255 | 255 |
| Total Vacant Employee Positions | 26 | 72 | 13 | 44 | 45 |
| Total Vacancy Percentage | 12.15% | 27.91% | 6.40% | 17.25% | 17.65% |
| Managerial Positions – S54A and S56 | 6 | 6 | 6 | 6 | 6 |
| Vacant Managerial Positions – S54A and S56 | 2 | 1 | 1 | 1 | 2 |
| Managerial Positions - by organogram | 11 | 11 | 15 | 15 | 14 |
| Vacant Managerial Positions - by organogram | 2 | 7 | 12 | 4 | 5 |
Service Delivery Statistics
| 2022/23 | 2021/22 | 2020/21 | 2019/20 | 2018/19 | |
| Water | |||||
| Does the municipality provide? | No | No | No | No | No |
| Number of households and non-domestic customers to which provided | 0 | 0 | 0 | 0 | 0 |
| Number of domestic households/delivery points | 0 | 0 | 0 | 0 | 0 |
| Inside the yard | 0 | 0 | 0 | 0 | 0 |
| Less than 200m from yard | 0 | 0 | 0 | 0 | 0 |
| More than 200m from yard | 0 | 0 | 0 | 0 | 0 |
| Domestic households with access to free basic service | 0 | 0 | 0 | 0 | 0 |
| Electricity | |||||
| Does the municipality provide? | No | No | No | No | No |
| Number of households and non-domestic customers to which provided | 26 190 | 26 190 | 26 190 | 26 190 | 25 995 |
| Domestic households with access to free basic service | 896 | 2 016 | 2 016 | 2 016 | 1 739 |
| Sewerage and Sanitation | |||||
| Does the municipality provide? | No | No | No | No | No |
| Number of households and non-domestic customers to which provided | 0 | 0 | 0 | 0 | 0 |
| Number of households using: | |||||
| Flush toilet - public sewerage | 0 | 0 | 0 | 0 | 0 |
| Flush toilet - septic tank | 0 | 0 | 0 | 0 | 0 |
| Ventilated pit latrine | 0 | 0 | 0 | 0 | 0 |
| Bucket system | 0 | 0 | 0 | 0 | 0 |
| Other | 0 | 0 | 0 | 0 | 0 |
| Domestic households with access to free basic service | 0 | 0 | 0 | 0 | 0 |
| Solid Waste Services | |||||
| Does the municipality provide? | Yes | Yes | Yes | Yes | Yes |
| Number of households and non-domestic customers to which provided | 2 044 | 2 044 | 2 044 | 2 044 | 2 044 |
| Domestic households with access to free basic service | 0 | 0 | 0 | 0 | 0 |