 G
G
Municipalities
Greater Letaba Local Municipality (LIM332)
Metropolitan, district, and local municipalities across South Africa.
LIM332
Active
https://www.greaterletaba.gov.za
Overview
Greater Letaba Local Municipality (LIM332) provides local government services and development management in Limpopo. Its work includes municipal administration, upkeep of local infrastructure and public amenities, and implementing by-laws and regulatory functions that shape orderly development. The municipality sets delivery priorities through its IDP and annual budgets, focusing on basic service access, asset maintenance and community development.
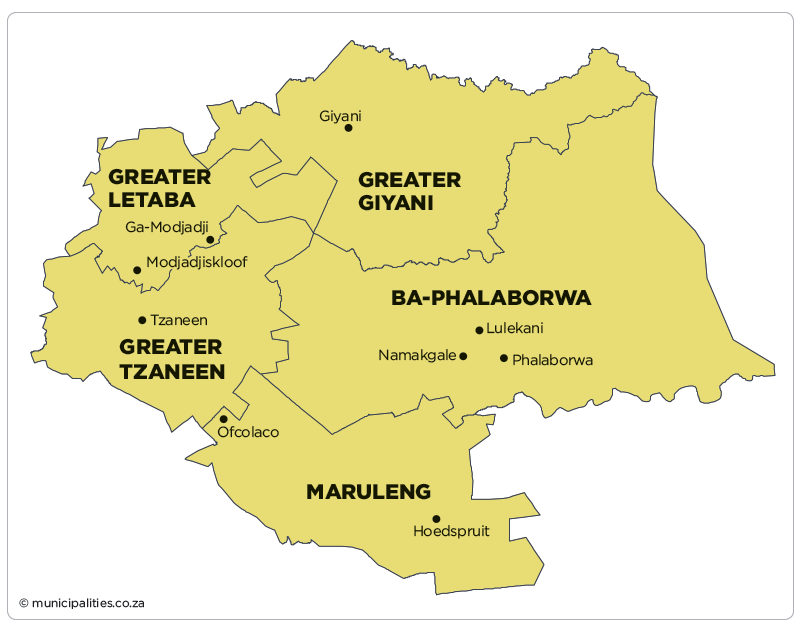
Map
Council & Management
Composition of Council:
ANC 47, EFF 8, COPE 2, DA 1, LIRA 1, MIM 1
Controlling Party:
ANC
Mayor:
Mr TD Mamanyoha (ANC)
Deputy Mayor:
n/a
Speaker:
Ms MM Mokgwathi (ANC)
Chief Whip:
Ms RR Ramalatso
Other Council:
Mr RG Baloyi (Exco: Infrastructure)
Mr TJ Kgapane (Exco: Finance)
Mr NF Lebeko (Exco: Corporate and Shared Services)
Mr MS Mangena (Exco: Environmental Affairs)
Mr MR Mosila (Exco: Community Services)
Ms MD Mothele (Exco: Public Transport and Roads)
Ms KE Ramaano (Exco: Sport, Arts and Culture)
Ms MJ Ramaremela (Exco: Economic Development, Housing and Spatial Planning)
Ms MG Selowa (Exco: Water and Sanitation)
Municipal Manager:
Mr MO Sewape
Chief Financial Officer:
Ms AN Sesene
Senior Management:
Mr MP Lekhota (Corporate Services)
Mr ML Mamatlepa (Community Services)
Ms G Nhlane (Technical Services)
Mr ML Phosa (Development and Town Planning)
Mr Eric Rabalela (Manager: LED)
Communications Officers:
Lovers Maenetje (Municipal Spokesperson)
Demographic Information
| 2022 | 2016 | 2011 | |
| Population | 261 038 | 218 030 | 213 932 |
| Age Structure | |||
| Population under 15 | 35.1% | 32.1% | 34.5% |
| Population 15 to 64 | 57.6% | 62.2% | 58.5% |
| Population over 65 | 7.4% | 5.7% | 6.9% |
| Dependency Ratio | |||
| Per 100 (15-64) | 73.7 | 60.7 | 70.8 |
| Sex Ratio | |||
| Males per 100 females | 82.3 | 82.7 | 81.1 |
| Population Growth | |||
| Per annum | 1.93% | 0.56% | n/a |
| Labour Market | |||
| Unemployment rate (official) | n/a | n/a | 40.3% |
| Youth unemployment rate (official) 15-34 | n/a | n/a | 49.9% |
| Education (aged 20 +) | |||
| No schooling | 23.7% | 26.7% | 27.0% |
| Matric | n/a | 20.5% | 17.7% |
| Higher education | 6.5% | 6.2% | 5.8% |
| Household Dynamics | |||
| Households | 65 220 | 67 067 | 58 612 |
| Average household size | 4.0 | 3.3 | 3.6 |
| Female headed households | n/a | 54.4% | 56.8% |
| Formal dwellings | 94.4% | 91.6% | 91.8% |
| Housing owned | n/a | 75.4% | 46.1% |
| Household Services | |||
| Flush toilet connected to sewerage | 20.0% | 7.2% | 10.2% |
| Weekly refuse removal | 17.4% | 8.6% | 8.5% |
| Piped water inside dwelling | 20.7% | 4.9% | 10.1% |
| Electricity for lighting | 97.0% | 95.4% | 90.8% |
Financial Results
| All values: R'000 | 2024/25 | 2023/24 | 2022/23 | 2021/22 | 2020/21 |
| AUDIT OUTCOME | n/a | Financially unqualified | Financially unqualified | Financially unqualified | Financially unqualified |
| FINANCIAL PERFORMANCE | |||||
| Property rates | 21 898 | 20 495 | 13 342 | 12 832 | 13 831 |
| Service charges | 31 629 | 32 144 | 23 041 | 23 489 | 17 174 |
| Investment revenue | 5 432 | 4 693 | 2 127 | 1 201 | 1 829 |
| Transfers recognised - operational | 399 132 | 381 031 | 374 359 | 324 221 | 364 887 |
| Other own revenue | 59 176 | 38 294 | 34 871 | 25 889 | 28 369 |
| Total Revenue (excluding capital transfers and contributions) | 517 268 | 476 658 | 447 741 | 387 631 | 426 090 |
| Employee costs | 155 669 | 142 226 | 128 438 | 121 858 | 122 842 |
| Remuneration of councillors | 33 706 | 32 203 | 24 163 | 22 892 | 23 655 |
| Depreciation and amortisation | 55 843 | 48 224 | 53 420 | 41 927 | 37 753 |
| Finance charges | 857 | 766 | 571 | 466 | 364 |
| Inventory consumed and bulk purchases | 33 854 | 32 661 | 30 916 | 29 669 | 27 015 |
| Transfers and subsidies | - | - | - | - | - |
| Other expenditure | 240 740 | 255 136 | 221 074 | 202 028 | 213 953 |
| Total Expenditure | 520 669 | 511 216 | 458 582 | 418 841 | 425 582 |
| Surplus/(Deficit) | (3 401) | (34 558) | (10 841) | (31 209) | 508 |
| Transfers and subsidies - capital (monetary allocations) | 95 905 | 67 346 | 79 007 | 66 451 | 63 527 |
| Transfers and subsidies - capital (in-kind) | - | - | - | 12 | - |
| Surplus/(Deficit) after capital transfers & contributions | 92 504 | 32 788 | 68 166 | 35 254 | 64 035 |
| Share of surplus/(deficit) of associate | - | - | - | - | - |
| Surplus/(Deficit) for the year | 92 504 | 32 788 | 68 166 | 35 254 | 64 035 |
| CAPITAL EXPENDITURE & FUNDS SOURCES | |||||
| Capital expenditure | 116 984 | 82 023 | 113 173 | 107 010 | 101 006 |
| Transfers recognised - capital | 81 199 | 54 503 | 66 459 | 50 188 | 46 924 |
| Borrowing | - | - | - | - | (1 211) |
| Internally generated funds | 35 785 | 24 013 | 45 266 | 56 609 | 56 040 |
| Total sources of capital funds | 116 984 | 78 516 | 111 725 | 106 797 | 101 752 |
| FINANCIAL POSITION | |||||
| Total current assets | 70 715 | 57 887 | 42 842 | 37 174 | 50 558 |
| Total non current assets | 1 281 428 | 1 214 716 | 1 167 163 | 1 106 174 | 1 042 161 |
| Total current liabilities | 121 328 | 131 465 | 109 817 | 101 576 | 88 223 |
| Total non current liabilities | 18 304 | 17 518 | 13 964 | 13 394 | 12 180 |
| Community wealth/Equity | 1 212 512 | 1 123 054 | 1 086 224 | 1 028 501 | 993 107 |
| CASH FLOWS | |||||
| Net cash from (used) operating | 249 315 | (48 998) | 250 305 | 232 490 | 254 122 |
| Net cash from (used) investing | (123 444) | (94 620) | (129 580) | (133 853) | (87 813) |
| Net cash from (used) financing | - | - | - | - | - |
| Cash/cash equivalents at the year end | 138 357 | (140 035) | 122 193 | 102 821 | 166 992 |
| UNAUTHORISED, IRREGULAR, FRUITLESS & WASTEFUL EXPENDITURE | |||||
| Unauthorised expenditure | n/a | 83 327 | 33 127 | 471 957 | 19 585 |
| Irregular expenditure | n/a | 3 921 | 18 261 | 21 518 | 33 872 |
| Fruitless & wasteful expenditure | n/a | 111 | 595 | 3 186 | 1 243 |
| SOURCE | Audited Outcome A1 2026 Q1 | Audited Outcome A1 2026 Q1 | Audited Outcome A1 2026 Q1 | Audited Outcome A1 2024 | Audited Outcome A1 2023 |
Employment Statistics
| 2022/23 | 2021/22 | 2020/21 | 2019/20 | 2018/19 | |
| Employment | |||||
| Employment Costs (R’000) | 128 438 | 121 858 | 122 842 | 109 247 | 121 826 |
| Remuneration of councillors (R’000) | 24 163 | 22 892 | 23 655 | 22 714 | 22 882 |
| Total Employee Positions | 309 | 335 | 265 | 259 | 333 |
| Total Vacant Employee Positions | 54 | 77 | 10 | 0 | 51 |
| Total Vacancy Percentage | 17.48% | 22.99% | 3.77% | 0.00% | 15.32% |
| Managerial Positions – S54A and S56 | 6 | 6 | 6 | 6 | 6 |
| Vacant Managerial Positions – S54A and S56 | 0 | 0 | 1 | 0 | 1 |
| Managerial Positions - by organogram | 27 | 27 | 27 | 27 | 18 |
| Vacant Managerial Positions - by organogram | 8 | 8 | 9 | 0 | 2 |
Service Delivery Statistics
| 2022/23 | 2021/22 | 2020/21 | 2019/20 | 2018/19 | |
| Water | |||||
| Does the municipality provide? | No | No | No | No | No |
| Number of households and non-domestic customers to which provided | 0 | 0 | 0 | 0 | 0 |
| Number of domestic households/delivery points | 0 | 0 | 0 | 0 | 0 |
| Inside the yard | 0 | 0 | 0 | 0 | 0 |
| Less than 200m from yard | 0 | 0 | 0 | 0 | 0 |
| More than 200m from yard | 0 | 0 | 0 | 0 | 0 |
| Domestic households with access to free basic service | 0 | 0 | 0 | 0 | 0 |
| Electricity | |||||
| Does the municipality provide? | Yes | Yes | Yes | Yes | Yes |
| Number of households and non-domestic customers to which provided | 66 103 | 65 127 | 65 127 | 64 772 | 64 772 |
| Domestic households with access to free basic service | 1 279 | 1 607 | 1 607 | 318 | 301 |
| Sewerage and Sanitation | |||||
| Does the municipality provide? | No | No | No | No | No |
| Number of households and non-domestic customers to which provided | 0 | 0 | 0 | 0 | 0 |
| Number of households using: | |||||
| Flush toilet - public sewerage | 0 | 0 | 0 | 0 | 0 |
| Flush toilet - septic tank | 0 | 0 | 0 | 0 | 0 |
| Ventilated pit latrine | 0 | 0 | 0 | 0 | 0 |
| Bucket system | 0 | 0 | 0 | 0 | 0 |
| Other | 0 | 0 | 0 | 0 | 0 |
| Domestic households with access to free basic service | 0 | 0 | 0 | 0 | 0 |
| Solid Waste Services | |||||
| Does the municipality provide? | Yes | Yes | Yes | Yes | Yes |
| Number of households and non-domestic customers to which provided | 4 742 | 4 742 | 4 742 | 4 654 | 4 654 |
| Domestic households with access to free basic service | 26 | 26 | 26 | 26 | 292 |