 G
G
Municipalities
Garden Route District Municipality (DC4)
Metropolitan, district, and local municipalities across South Africa.
DC4
Active
https://www.gardenroute.gov.za
Overview
Garden Route District Municipality (DC4) is a district authority in the Western Cape that coordinates regional planning and provides shared support to its local municipalities. It helps drive district-wide development strategies, collaborative infrastructure initiatives and capacity-building where joint delivery improves efficiency. The district also supports alignment across municipalities for planning, disaster readiness and programmes that require coordinated regional oversight.
Geography, History & Economy
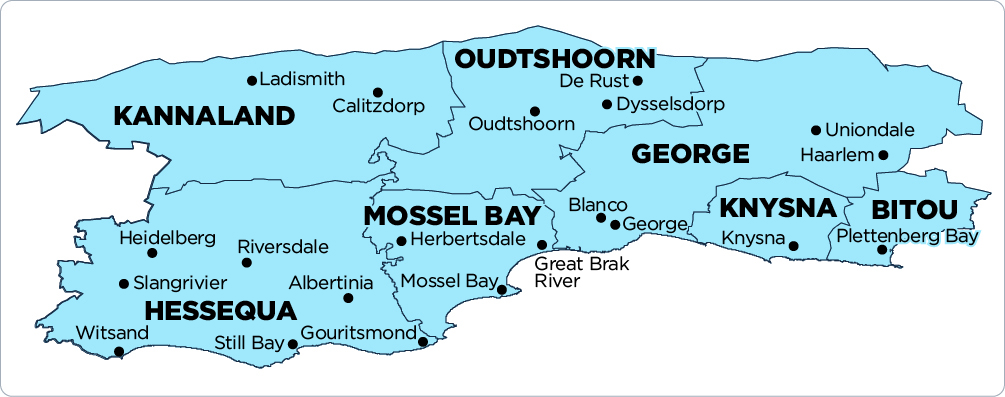
- Bitou Local Municipality
- George Local Municipality
- Hessequa Local Municipality
- Kannaland Local Municipality
- Knysna Local Municipality
- Mossel Bay Local Municipality
- Oudtshoorn Local Municipality
Map
Council & Management
Composition of Council:
DA 17, ANC 10, GOOD 2, ICOSA 3, PBI 2, VF PLUS 1 (40% PR Seats)
Controlling Party:
Coalition DA/ICOSA
Mayor:
Mr Marais Kruger (DA)
Deputy Mayor:
Mr Vlancio Donson (ICOSA)
Speaker:
Ms Georlene Wolmarans (DA)
Chief Whip:
Mr Koos Malooi
Other Council:
Mr Daniel Cronjé (Portfolio Chairperson: Roads and Transport Services)
Mr Jobieth Hoogbaard (Portfolio Chairperson: Community Services)
Mr Werner Meshoa (Portfolio Chairperson: Strategic Services)
Ms Nompumelelo Ndayi (Portfolio Chairperson: Corporate Services)
Ms Rosina Ruiters (Portfolio Chairperson: Planning and Economic Development)
Mr Hilton Stroebel (Portfolio Chairperson: Property and Asset Management)
Mr Dave Swart (Portfolio Chairperson: Financial Services)
Municipal Manager:
Mr Monde Stratu
Chief Financial Officer:
Mr Rian Boshoff
Senior Management:
Mr Lusanda Menze (Executive Manager: Integrated Planning and Economic Development)
Ms Nthabeleng Mavis Raisa-Mlandu (Executive Manager: Community Services)
Communications Officers:
Mr Herman Pieters (Manager: Communications)
Demographic Information
| 2022 | 2016 | 2011 | |
| Population | 838 457 | 611 278 | 574 265 |
| Age Structure | |||
| Population under 15 | 22.2% | 25.4% | 25.9% |
| Population 15 to 64 | 67.6% | 66.8% | 66.3% |
| Population over 65 | 10.2% | 7.8% | 7.8% |
| Dependency Ratio | |||
| Per 100 (15-64) | 47.9 | 49.7 | 50.7 |
| Sex Ratio | |||
| Males per 100 females | 94.4 | 96.2 | 95.8 |
| Population Growth | |||
| Per annum | 3.67% | 1.42% | n/a |
| Labour Market | |||
| Unemployment rate (official) | n/a | n/a | 22.5% |
| Youth unemployment rate (official) 15-34 | n/a | n/a | 29.9% |
| Education (aged 20 +) | |||
| No schooling | 2.4% | 2.9% | 3.7% |
| Matric | n/a | 33.9% | 28.0% |
| Higher education | 13.7% | 9.0% | 10.6% |
| Household Dynamics | |||
| Households | 255 977 | 189 345 | 164 103 |
| Average household size | 3.3 | 3.2 | 3.5 |
| Female headed households | n/a | 36.1% | 33.9% |
| Formal dwellings | 89.0% | 85.7% | 83.8% |
| Housing owned | n/a | 69.5% | 55.0% |
| Household Services | |||
| Flush toilet connected to sewerage | 93.7% | 88.7% | 85.2% |
| Weekly refuse removal | 88.8% | 88.8% | 86.4% |
| Piped water inside dwelling | 85.0% | 75.8% | 71.8% |
| Electricity for lighting | 95.9% | 95.6% | 91.1% |
Financial Results
| All values: R'000 | 2024/25 | 2023/24 | 2022/23 | 2021/22 | 2020/21 |
| AUDIT OUTCOME | n/a | Clean audit | Clean audit | Clean audit | Clean audit |
| FINANCIAL PERFORMANCE | |||||
| Property rates | - | - | - | - | - |
| Service charges | 8 389 | - | - | - | - |
| Investment revenue | 16 541 | 12 400 | 10 253 | 8 271 | 8 822 |
| Transfers recognised - operational | 211 404 | 196 854 | 189 810 | 183 567 | 179 338 |
| Other own revenue | 222 899 | 225 520 | 215 857 | 204 598 | 190 850 |
| Total Revenue (excluding capital transfers and contributions) | 459 233 | 434 774 | 415 921 | 396 435 | 379 010 |
| Employee costs | 314 575 | 308 454 | 280 163 | 275 308 | 256 939 |
| Remuneration of councillors | 13 953 | 11 983 | 12 306 | 11 829 | 11 210 |
| Depreciation and amortisation | 7 565 | 6 435 | 5 766 | 4 605 | 4 171 |
| Finance charges | 435 | 4 664 | 148 | 28 | 55 |
| Inventory consumed and bulk purchases | 46 480 | 51 625 | 51 426 | 44 148 | 40 398 |
| Transfers and subsidies | 8 904 | 5 805 | 4 642 | 5 296 | 2 052 |
| Other expenditure | 98 786 | 79 172 | 79 533 | 74 405 | (314 826) |
| Total Expenditure | 490 697 | 468 139 | 433 984 | 415 618 | (1) |
| Surplus/(Deficit) | (31 464) | (33 365) | (18 064) | (19 183) | 379 010 |
| Transfers and subsidies - capital (monetary allocations) | 2 563 | 13 072 | 3 765 | - | - |
| Transfers and subsidies - capital (in-kind) | 2 493 | 13 | 3 284 | 57 | - |
| Surplus/(Deficit) after capital transfers & contributions | (26 408) | (20 280) | (11 015) | (19 126) | 379 010 |
| Share of surplus/(deficit) of associate | - | - | - | - | - |
| Surplus/(Deficit) for the year | (26 408) | (20 280) | (11 015) | (19 126) | 379 010 |
| CAPITAL EXPENDITURE & FUNDS SOURCES | |||||
| Capital expenditure | 60 895 | (0) | - | 0 | (0) |
| Transfers recognised - capital | 2 934 | 8 046 | 3 149 | - | - |
| Borrowing | 45 817 | (13) | - | - | - |
| Internally generated funds | 12 143 | (8 033) | (3 149) | (4 029) | (4 294) |
| Total sources of capital funds | 60 895 | (0) | - | (4 029) | (4 294) |
| FINANCIAL POSITION | |||||
| Total current assets | 230 168 | 230 014 | 155 407 | 180 479 | 219 692 |
| Total non current assets | 339 864 | 355 895 | 315 923 | 295 430 | 286 149 |
| Total current liabilities | 88 995 | 85 416 | 74 887 | 64 453 | 77 275 |
| Total non current liabilities | 264 922 | 262 380 | 141 634 | 143 987 | 138 170 |
| Community wealth/Equity | 216 115 | 238 113 | 254 809 | 267 469 | 290 396 |
| CASH FLOWS | |||||
| Net cash from (used) operating | 35 572 | 109 259 | 15 467 | 223 738 | 73 504 |
| Net cash from (used) investing | 17 167 | (46 318) | (28 287) | (8 144) | (16 061) |
| Net cash from (used) financing | 63 000 | 116 912 | - | - | - |
| Cash/cash equivalents at the year end | 272 555 | 336 668 | 123 584 | 357 652 | 227 195 |
| UNAUTHORISED, IRREGULAR, FRUITLESS & WASTEFUL EXPENDITURE | |||||
| Unauthorised expenditure | n/a | 11 965 | 6 943 | - | 1 367 |
| Irregular expenditure | n/a | 35 065 | 16 567 | 19 752 | 25 154 |
| Fruitless & wasteful expenditure | n/a | 92 | 57 | - | - |
| SOURCE | Audited Outcome A1 2026 Q1 | Audited Outcome A1 2026 Q1 | Audited Outcome A1 2026 Q1 | Audited Outcome A1 2024 | Audited Outcome A1 2023 |
Employment Statistics
| 2022/23 | 2021/22 | 2020/21 | 2019/20 | 2018/19 | |
| Employment | |||||
| Employment Costs (R’000) | 280 163 | 275 308 | 256 939 | 211 069 | 222 005 |
| Remuneration of councillors (R’000) | 12 306 | 11 829 | 11 210 | 11 467 | 11 053 |
| Total Employee Positions | 624 | 619 | 560 | 546 | 599 |
| Total Vacant Employee Positions | 55 | 48 | 1 | 0 | 53 |
| Total Vacancy Percentage | 8.81% | 7.75% | 0.18% | 0.00% | 8.85% |
| Managerial Positions – S54A and S56 | 6 | 6 | 6 | 5 | 5 |
| Vacant Managerial Positions – S54A and S56 | 1 | 0 | 1 | 0 | 0 |
| Managerial Positions - by organogram | 27 | 26 | 21 | 21 | 25 |
| Vacant Managerial Positions - by organogram | 0 | 0 | 0 | 0 | 3 |
Service Delivery Statistics
| 2022/23 | 2021/22 | 2020/21 | 2019/20 | 2018/19 | |
| Water | |||||
| Does the municipality provide? | No | No | No | No | No |
| Number of households and non-domestic customers to which provided | 0 | 0 | 0 | 0 | 0 |
| Number of domestic households/delivery points | 0 | 0 | 0 | 0 | 0 |
| Inside the yard | 0 | 0 | 0 | 0 | 0 |
| Less than 200m from yard | 0 | 0 | 0 | 0 | 0 |
| More than 200m from yard | 0 | 0 | 0 | 0 | 0 |
| Domestic households with access to free basic service | 0 | 0 | 0 | 0 | 0 |
| Electricity | |||||
| Does the municipality provide? | No | No | No | No | No |
| Number of households and non-domestic customers to which provided | 0 | 0 | 0 | 0 | 0 |
| Domestic households with access to free basic service | 0 | 0 | 0 | 0 | 0 |
| Sewerage and Sanitation | |||||
| Does the municipality provide? | No | No | No | No | No |
| Number of households and non-domestic customers to which provided | 0 | 0 | 0 | 0 | 0 |
| Number of households using: | |||||
| Flush toilet - public sewerage | 0 | 0 | 0 | 0 | 0 |
| Flush toilet - septic tank | 0 | 0 | 0 | 0 | 0 |
| Ventilated pit latrine | 0 | 0 | 0 | 0 | 0 |
| Bucket system | 0 | 0 | 0 | 0 | 0 |
| Other | 0 | 0 | 0 | 0 | 0 |
| Domestic households with access to free basic service | 0 | 0 | 0 | 0 | 0 |
| Solid Waste Services | |||||
| Does the municipality provide? | No | No | No | No | No |
| Number of households and non-domestic customers to which provided | 0 | 0 | 0 | 0 | 0 |
| Domestic households with access to free basic service | 0 | 0 | 0 | 0 | 0 |