 D
D
Municipalities
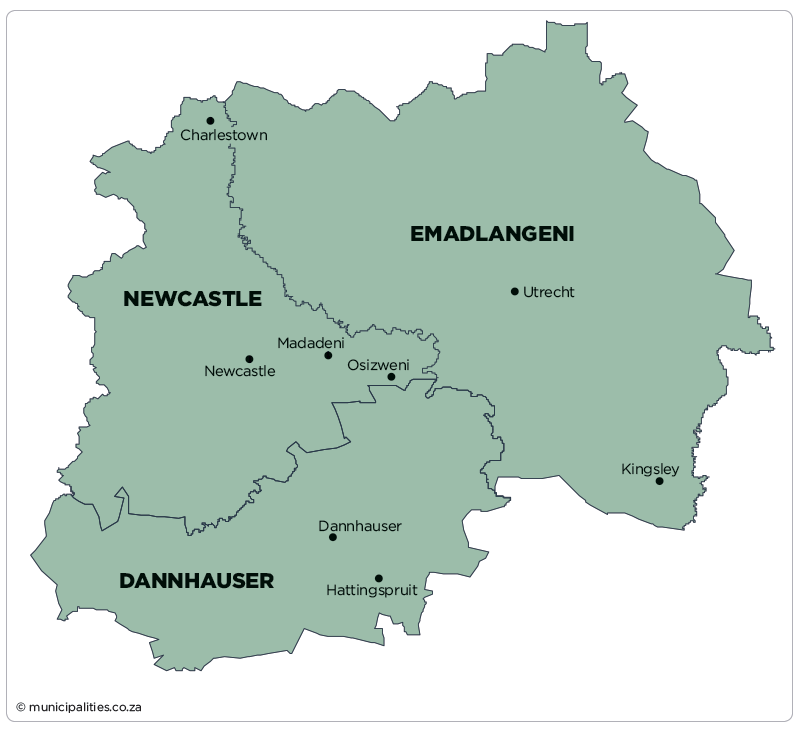
Dannhauser Local Municipality (KZN254)
Metropolitan, district, and local municipalities across South Africa.
KZN254
Active
https://www.dannhauser.gov.za
Overview
Dannhauser Local Municipality (KZN254) delivers municipal services and manages local governance and development planning in its area. It oversees municipal administration, service delivery coordination, and planning processes that support community infrastructure and economic activity. This profile consolidates key reference information for residents and stakeholders.
Map
Council & Management
Composition of Council:
ANC 9, IFP 9, EFF 3, ABC 1, CFP 1, DA 1, ITSSA 1
Controlling Party:
Hung Council
Mayor:
BA Hadebe (ANC)
Deputy Mayor:
n/a
Speaker:
Mr Sibusiso Ndlela (IFP)
Chief Whip:
MS Mkhumane
Other Council:
SEC Kunene
RN Made
S Nzuza
Municipal Manager:
Mr MS Sithole
Chief Financial Officer:
Mr N Majola
Senior Management:
Mrs LP Gcabashe (Director: Technical Services)
Ms T Mthethwa
Mr Mfanafuthi Ngwabe
Mr SS Nkabinde (Acting Manager: Planning and Economic Development)
Communications Officers:
Ms N Mahlaba
Demographic Information
| 2022 | 2016 | 2011 | |
| Population | 142 750 | 105 341 | 102 937 |
| Age Structure | |||
| Population under 15 | 32.5% | 40.0% | 38.2% |
| Population 15 to 64 | 61.8% | 56.0% | 56.7% |
| Population over 65 | 5.7% | 4.0% | 5.1% |
| Dependency Ratio | |||
| Per 100 (15-64) | 61.8 | 78.5 | 76.3 |
| Sex Ratio | |||
| Males per 100 females | 93.1 | 89.9 | 90.0 |
| Population Growth | |||
| Per annum | 3.17% | 0.52% | n/a |
| Labour Market | |||
| Unemployment rate (official) | n/a | n/a | n/a |
| Youth unemployment rate (official) 15-34 | n/a | n/a | n/a |
| Education (aged 20 +) | |||
| No schooling | 6.4% | 5.5% | 9.0% |
| Matric | n/a | 31.7% | 25.4% |
| Higher education | 5.5% | 3.9% | 3.5% |
| Household Dynamics | |||
| Households | 25 479 | 20 242 | 20 580 |
| Average household size | 5.6 | 5.2 | 5.0 |
| Female headed households | n/a | 50.2% | 50.6% |
| Formal dwellings | 85.5% | 69.3% | 82.3% |
| Housing owned | n/a | 55.6% | 45.5% |
| Household Services | |||
| Flush toilet connected to sewerage | 23.8% | 10.4% | 12.9% |
| Weekly refuse removal | 21.9% | 9.6% | 11.5% |
| Piped water inside dwelling | 25.4% | 13.8% | 19.5% |
| Electricity for lighting | 93.9% | 91.2% | 80.7% |
Financial Results
| All values: R'000 | 2024/25 | 2023/24 | 2022/23 | 2021/22 | 2020/21 |
| AUDIT OUTCOME | n/a | Financially unqualified | Financially unqualified | Financially unqualified | Qualified audit |
| FINANCIAL PERFORMANCE | |||||
| Property rates | 42 201 | 44 591 | 30 853 | 28 115 | 21 084 |
| Service charges | 5 174 | 1 349 | 1 345 | 1 302 | 1 246 |
| Investment revenue | 2 827 | 2 080 | 1 150 | 668 | 1 019 |
| Transfers recognised - operational | 125 895 | 119 816 | 114 744 | 103 833 | 114 602 |
| Other own revenue | 6 670 | 4 460 | 6 358 | 4 249 | 2 579 |
| Total Revenue (excluding capital transfers and contributions) | 182 768 | 172 295 | 154 451 | 138 166 | 140 530 |
| Employee costs | 67 917 | 40 860 | 40 141 | 32 778 | 31 941 |
| Remuneration of councillors | 12 629 | 12 921 | 10 806 | 9 599 | 9 469 |
| Depreciation and amortisation | 34 970 | 39 978 | 88 091 | 31 560 | 36 886 |
| Finance charges | 2 701 | 3 231 | 3 663 | 4 863 | 4 140 |
| Inventory consumed and bulk purchases | 1 037 | 3 180 | 7 544 | 6 572 | 8 441 |
| Transfers and subsidies | - | - | - | - | - |
| Other expenditure | 111 332 | 92 712 | 85 734 | 63 286 | 59 620 |
| Total Expenditure | 230 586 | 192 882 | 235 977 | 148 658 | 150 496 |
| Surplus/(Deficit) | (47 818) | (20 586) | (81 527) | (10 491) | (9 966) |
| Transfers and subsidies - capital (monetary allocations) | 28 022 | 28 629 | 28 441 | 28 611 | 13 645 |
| Transfers and subsidies - capital (in-kind) | - | - | 102 | - | - |
| Surplus/(Deficit) after capital transfers & contributions | (19 796) | 8 042 | (52 984) | 18 119 | 3 679 |
| Share of surplus/(deficit) of associate | - | - | - | - | - |
| Surplus/(Deficit) for the year | (19 796) | 8 042 | (52 984) | 18 119 | 3 679 |
| CAPITAL EXPENDITURE & FUNDS SOURCES | |||||
| Capital expenditure | 46 064 | 26 035 | 41 572 | 51 145 | 66 426 |
| Transfers recognised - capital | 7 179 | - | - | 21 037 | 26 031 |
| Borrowing | - | - | - | - | - |
| Internally generated funds | 122 | - | (1 005) | 24 711 | 31 737 |
| Total sources of capital funds | 7 300 | - | (1 005) | 45 748 | 57 768 |
| FINANCIAL POSITION | |||||
| Total current assets | 45 215 | 42 108 | 37 084 | 23 505 | 36 964 |
| Total non current assets | 541 993 | 528 937 | 533 633 | 583 254 | 469 024 |
| Total current liabilities | 80 673 | 45 716 | 53 548 | 49 980 | 39 011 |
| Total non current liabilities | 35 928 | 35 961 | 35 843 | 33 183 | 40 923 |
| Community wealth/Equity | 539 519 | 489 368 | 481 326 | 525 185 | 426 054 |
| CASH FLOWS | |||||
| Net cash from (used) operating | (16 795) | 11 509 | 194 484 | 231 526 | 172 580 |
| Net cash from (used) investing | (26 303) | (29 356) | (43 454) | (57 858) | (91 849) |
| Net cash from (used) financing | 9 | (5 196) | - | - | 29 711 |
| Cash/cash equivalents at the year end | (23 495) | (15 254) | 165 997 | 185 469 | 32 778 |
| UNAUTHORISED, IRREGULAR, FRUITLESS & WASTEFUL EXPENDITURE | |||||
| Unauthorised expenditure | n/a | 28 825 | 64 654 | 37 743 | - |
| Irregular expenditure | n/a | 26 398 | 4 196 | 76 462 | 21 639 |
| Fruitless & wasteful expenditure | n/a | 82 | 34 | 400 | - |
| SOURCE | Audited Outcome A1 2026 Q1 | Audited Outcome A1 2026 Q1 | Audited Outcome A1 2026 Q1 | Audited Outcome A1 2024 | Audited Outcome A1 2023 |
Employment Statistics
| 2022/23 | 2021/22 | 2020/21 | 2019/20 | 2018/19 | |
| Employment | |||||
| Employment Costs (R’000) | 40 141 | 32 778 | 31 941 | 27 034 | 30 891 |
| Remuneration of councillors (R’000) | 10 806 | 9 599 | 9 469 | 10 704 | 9 044 |
| Total Employee Positions | 163 | 138 | 95 | 102 | 83 |
| Total Vacant Employee Positions | 81 | 41 | 1 | 4 | 0 |
| Total Vacancy Percentage | 49.69% | 29.71% | 1.05% | 3.92% | 0.00% |
| Managerial Positions – S54A and S56 | 5 | 5 | 5 | 5 | 5 |
| Vacant Managerial Positions – S54A and S56 | 2 | 0 | 0 | 0 | 0 |
| Managerial Positions - by organogram | 8 | 8 | 8 | 8 | 4 |
| Vacant Managerial Positions - by organogram | 3 | 1 | 1 | 4 | 0 |
Service Delivery Statistics
| 2022/23 | 2021/22 | 2020/21 | 2019/20 | 2018/19 | |
| Water | |||||
| Does the municipality provide? | No | No | No | No | No |
| Number of households and non-domestic customers to which provided | 0 | 0 | 0 | 0 | 0 |
| Number of domestic households/delivery points | 0 | 0 | 0 | 0 | 0 |
| Inside the yard | 0 | 0 | 0 | 0 | 0 |
| Less than 200m from yard | 0 | 0 | 0 | 0 | 0 |
| More than 200m from yard | 0 | 0 | 0 | 0 | 0 |
| Domestic households with access to free basic service | 0 | 0 | 0 | 0 | 0 |
| Electricity | |||||
| Does the municipality provide? | No | No | No | No | No |
| Number of households and non-domestic customers to which provided | 7 602 | 7 602 | 7 602 | 5 060 | 4 451 |
| Domestic households with access to free basic service | 1 162 | 1 365 | 1 365 | 1 420 | 1 497 |
| Sewerage and Sanitation | |||||
| Does the municipality provide? | No | No | No | No | No |
| Number of households and non-domestic customers to which provided | 0 | 0 | 0 | 0 | 0 |
| Number of households using: | |||||
| Flush toilet - public sewerage | 0 | 0 | 0 | 0 | 0 |
| Flush toilet - septic tank | 0 | 0 | 0 | 0 | 0 |
| Ventilated pit latrine | 0 | 0 | 0 | 0 | 0 |
| Bucket system | 0 | 0 | 0 | 0 | 0 |
| Other | 0 | 0 | 0 | 0 | 0 |
| Domestic households with access to free basic service | 0 | 0 | 0 | 0 | 0 |
| Solid Waste Services | |||||
| Does the municipality provide? | Yes | Yes | Yes | Yes | Yes |
| Number of households and non-domestic customers to which provided | 6 829 | 6 829 | 6 829 | 6 829 | 4 738 |
| Domestic households with access to free basic service | 120 | 95 | 95 | 113 | 113 |