 C
C
Municipalities
Capricorn District Municipality (DC35)
Metropolitan, district, and local municipalities across South Africa.
DC35
Active
https://www.cdm.org.za
Overview
Capricorn District Municipality (DC35) is a district authority responsible for coordinating development planning and supporting service delivery across its constituent local municipalities. It plays a role in strategic infrastructure planning, inter-municipal coordination, and shared services where scale is important. This profile provides a structured public reference and context for the district’s governance role.
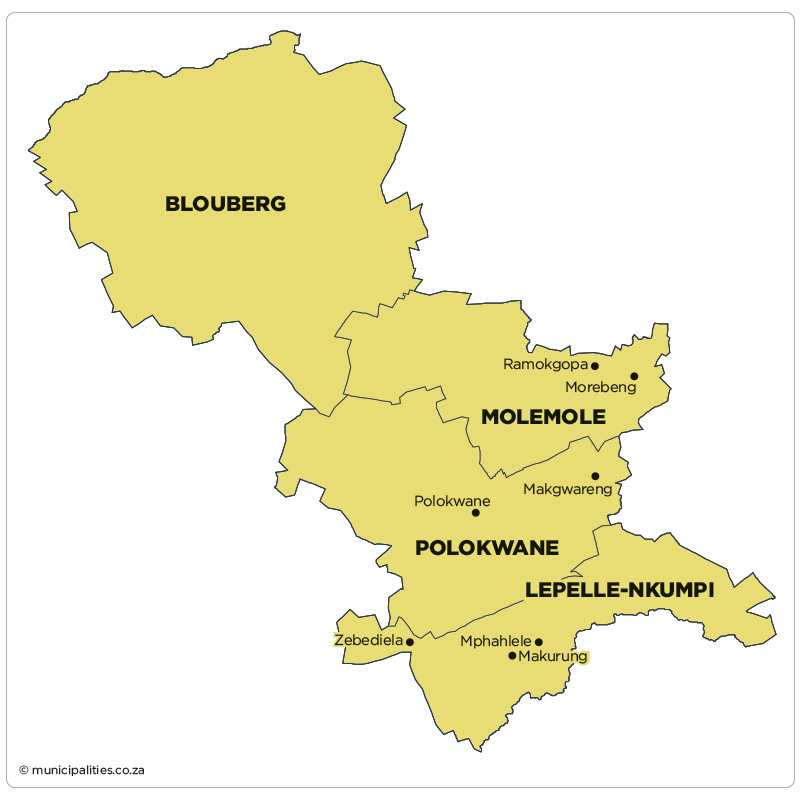
Geography, History & Economy
- Blouberg Local Municipality
- Lepelle-Nkumpi Local Municipality
- Molemole Local Municipality
- Polokwane Local Municipality
Map
Council & Management
Composition of Council:
ANC 15, EFF 5, DA 1, DOP 1 (40% PR Seats)
Controlling Party:
n/a
Executive Mayor:
Mr Mamedupi Teffo (ANC)
Deputy Mayor:
n/a
Speaker:
Kholefelo Lehong (ANC)
Chief Whip:
Mr Lesiba Matsemela
Other Council:
Mr Solly Mahlatjie (MMC: Strategic Executive Management Services)
Ms Makgalemela Makhura (MMC: Sports, Arts and Culture)
Ms Caroline Mamabolo (MMC: Local Economic Development)
Mr Matome Calvin Masoga (MMC: Development Planning and Environmental Management)
Ms Maite Mohale (MMC: Infrastructure Services)
Ms Elizabeth Rahlana (MMC: Community Services)
Ms Maria Ramokolo (MMC: Finance)
Mr Samson Selamolela (MMC: Corporate Services)
Municipal Manager:
Mr NR Selepe
Chief Financial Officer:
Mr Tebogo Malaka
Senior Management:
Ms Nompumelelo Khumalo ( Executive Manager: Strategic Executive Management Services )
Makgato Machaba (Executive Manager: Corporate Services)
Thuso Nemugumoni (Executive Management)
Communications Officers:
Mr Jabu Masondo
Demographic Information
| 2022 | 2016 | 2011 | |
| Population | 1 447 103 | 1 330 436 | 1 261 463 |
| Age Structure | |||
| Population under 15 | 30.2% | 33.6% | 33.6% |
| Population 15 to 64 | 62.3% | 60.6% | 59.9% |
| Population over 65 | 7.5% | 5.8% | 6.6% |
| Dependency Ratio | |||
| Per 100 (15-64) | 60.6 | 65.0 | 67.0 |
| Sex Ratio | |||
| Males per 100 females | 90.3 | 88.7 | 87.9 |
| Population Growth | |||
| Per annum | 1.33% | 1.21% | n/a |
| Labour Market | |||
| Unemployment rate (official) | n/a | n/a | 37.2% |
| Youth unemployment rate (official) 15-34 | n/a | n/a | 47.4% |
| Education (aged 20 +) | |||
| No schooling | 10.3% | 12.4% | 13.2% |
| Matric | n/a | 29.9% | 24.9% |
| Higher education | 13.7% | 11.4% | 12.8% |
| Household Dynamics | |||
| Households | 427 174 | 378 301 | 342 836 |
| Average household size | 3.4 | 3.5 | 3.7 |
| Female headed households | n/a | 49.1% | 49.9% |
| Formal dwellings | 95.8% | 93.2% | 92.0% |
| Housing owned | n/a | 69.8% | 58.1% |
| Household Services | |||
| Flush toilet connected to sewerage | 41.9% | 30.2% | 28.5% |
| Weekly refuse removal | 39.9% | 30.4% | 29.7% |
| Piped water inside dwelling | 38.1% | 19.5% | 23.3% |
| Electricity for lighting | 95.8% | 95.2% | 87.4% |
Financial Results
| All values: R'000 | 2024/25 | 2023/24 | 2022/23 | 2021/22 | 2020/21 |
| AUDIT OUTCOME | n/a | Clean audit | Financially unqualified | Clean audit | Financially unqualified |
| FINANCIAL PERFORMANCE | |||||
| Property rates | - | - | - | - | - |
| Service charges | 84 535 | 78 861 | 84 041 | 81 788 | 81 097 |
| Investment revenue | 72 255 | 63 637 | 49 039 | 26 831 | 23 740 |
| Transfers recognised - operational | 838 747 | 797 795 | 767 198 | 714 743 | 709 153 |
| Other own revenue | 52 976 | 50 143 | 69 063 | 36 858 | 32 695 |
| Total Revenue (excluding capital transfers and contributions) | 1 048 513 | 990 436 | 969 341 | 860 220 | 846 685 |
| Employee costs | 385 493 | 366 472 | 353 602 | 344 730 | 338 860 |
| Remuneration of councillors | 16 888 | 17 236 | 16 329 | 14 957 | 15 213 |
| Depreciation and amortisation | 101 230 | 97 620 | 90 567 | 84 230 | 84 623 |
| Finance charges | 240 | 59 | 116 | 211 | 115 |
| Inventory consumed and bulk purchases | 102 090 | 101 950 | 65 083 | 51 597 | 80 338 |
| Transfers and subsidies | - | - | - | - | 337 |
| Other expenditure | 422 143 | 428 243 | 377 343 | 381 229 | 305 100 |
| Total Expenditure | 1 028 084 | 1 011 580 | 903 040 | 876 955 | 824 586 |
| Surplus/(Deficit) | 20 429 | (21 143) | 66 301 | (16 735) | 22 099 |
| Transfers and subsidies - capital (monetary allocations) | 421 831 | 441 263 | 380 891 | 325 670 | 334 669 |
| Transfers and subsidies - capital (in-kind) | 155 | 1 912 | 68 | 148 | - |
| Surplus/(Deficit) after capital transfers & contributions | 442 415 | 422 032 | 447 260 | 309 083 | 356 768 |
| Share of surplus/(deficit) of associate | - | - | - | - | - |
| Surplus/(Deficit) for the year | 442 415 | 422 032 | 447 260 | 309 083 | 356 768 |
| CAPITAL EXPENDITURE & FUNDS SOURCES | |||||
| Capital expenditure | 483 858 | 458 852 | 399 071 | 346 025 | 381 733 |
| Transfers recognised - capital | 363 420 | (120 777) | 281 573 | 240 367 | 283 963 |
| Borrowing | - | - | - | - | - |
| Internally generated funds | 120 438 | 127 319 | 117 498 | 105 658 | 92 626 |
| Total sources of capital funds | 483 858 | 6 542 | 399 071 | 346 025 | 376 589 |
| FINANCIAL POSITION | |||||
| Total current assets | 781 147 | 703 699 | 709 824 | 619 647 | 515 901 |
| Total non current assets | 4 604 841 | 4 235 951 | 3 806 771 | 3 458 985 | 3 161 251 |
| Total current liabilities | 247 771 | 386 193 | 314 030 | 303 085 | 201 713 |
| Total non current liabilities | 131 004 | 118 742 | 107 541 | 128 035 | 62 938 |
| Community wealth/Equity | 5 007 213 | 4 434 715 | 4 095 024 | 3 647 512 | 3 412 502 |
| CASH FLOWS | |||||
| Net cash from (used) operating | 555 852 | 1 848 110 | 1 733 422 | 1 560 451 | 983 040 |
| Net cash from (used) investing | (469 806) | (472 589) | (485 824) | (393 953) | (451 290) |
| Net cash from (used) financing | - | - | - | - | - |
| Cash/cash equivalents at the year end | 666 779 | 1 956 254 | 1 741 298 | 1 593 764 | 885 640 |
| UNAUTHORISED, IRREGULAR, FRUITLESS & WASTEFUL EXPENDITURE | |||||
| Unauthorised expenditure | n/a | - | - | - | - |
| Irregular expenditure | n/a | 214 514 | 192 957 | 72 | 2 476 |
| Fruitless & wasteful expenditure | n/a | 64 | 4 075 | 1 403 | 701 |
| SOURCE | Audited Outcome A1 2026 Q1 | Audited Outcome A1 2026 Q1 | Audited Outcome A1 2026 Q1 | Audited Outcome A1 2024 | Audited Outcome A1 2023 |
Employment Statistics
| 2022/23 | 2021/22 | 2020/21 | 2019/20 | 2018/19 | |
| Employment | |||||
| Employment Costs (R’000) | 353 602 | 344 730 | 338 860 | 320 370 | 296 726 |
| Remuneration of councillors (R’000) | 16 329 | 14 957 | 15 213 | 15 155 | 14 190 |
| Total Employee Positions | 547 | 972 | 591 | 587 | 992 |
| Total Vacant Employee Positions | 19 | 395 | 20 | 20 | 455 |
| Total Vacancy Percentage | 3.47% | 40.64% | 3.38% | 3.41% | 45.87% |
| Managerial Positions – S54A and S56 | 7 | 7 | 7 | 7 | 7 |
| Vacant Managerial Positions – S54A and S56 | 2 | 2 | 1 | 2 | 1 |
| Managerial Positions - by organogram | 46 | 46 | 46 | 47 | 28 |
| Vacant Managerial Positions - by organogram | 17 | 17 | 19 | 18 | 2 |
Service Delivery Statistics
| 2022/23 | 2021/22 | 2020/21 | 2019/20 | 2018/19 | |
| Water | |||||
| Does the municipality provide? | Yes | Yes | Yes | Yes | Yes |
| Number of households and non-domestic customers to which provided | 163 902 | 159 802 | 159 802 | 151 251 | 148 848 |
| Number of domestic households/delivery points | 160 850 | 156 750 | 156 750 | 148 199 | 144 026 |
| Inside the yard | 69 087 | 64 987 | 64 987 | 59 488 | 57 846 |
| Less than 200m from yard | 85 711 | 85 711 | 85 711 | 85 711 | 83 180 |
| More than 200m from yard | 6 052 | 6 052 | 6 052 | 3 000 | 3 000 |
| Domestic households with access to free basic service | 5 240 | 4 888 | 4 888 | 4 888 | 36 422 |
| Electricity | |||||
| Does the municipality provide? | No | No | No | No | No |
| Number of households and non-domestic customers to which provided | 0 | 0 | 0 | 0 | 0 |
| Domestic households with access to free basic service | 0 | 0 | 0 | 0 | 0 |
| Sewerage and Sanitation | |||||
| Does the municipality provide? | Yes | Yes | Yes | Yes | Yes |
| Number of households and non-domestic customers to which provided | 97 364 | 95 819 | 95 819 | 93 759 | 89 617 |
| Number of households using: | |||||
| Flush toilet - public sewerage | 11 642 | 11 642 | 11 642 | 11 642 | 10 000 |
| Flush toilet - septic tank | 0 | 0 | 0 | 0 | 0 |
| Ventilated pit latrine | 84 486 | 82 941 | 82 941 | 80 881 | 78 381 |
| Bucket system | 0 | 0 | 0 | 0 | 0 |
| Other | 0 | 0 | 0 | 0 | 0 |
| Domestic households with access to free basic service | 5 240 | 4 888 | 4 888 | 4 888 | 36 422 |
| Solid Waste Services | |||||
| Does the municipality provide? | No | No | No | No | No |
| Number of households and non-domestic customers to which provided | 0 | 0 | 0 | 0 | 0 |
| Domestic households with access to free basic service | 0 | 0 | 0 | 0 | 0 |