 B
B
Municipalities
Blouberg Local Municipality (LIM351)
Metropolitan, district, and local municipalities across South Africa.
LIM351
Active
https://www.blouberg.gov.za
Overview
Blouberg Local Municipality (LIM351) is responsible for municipal governance and service delivery within its municipal area. It manages local planning, service coordination, and administrative functions that shape infrastructure and community outcomes. This profile consolidates public reference details to support understanding of the municipality’s role.
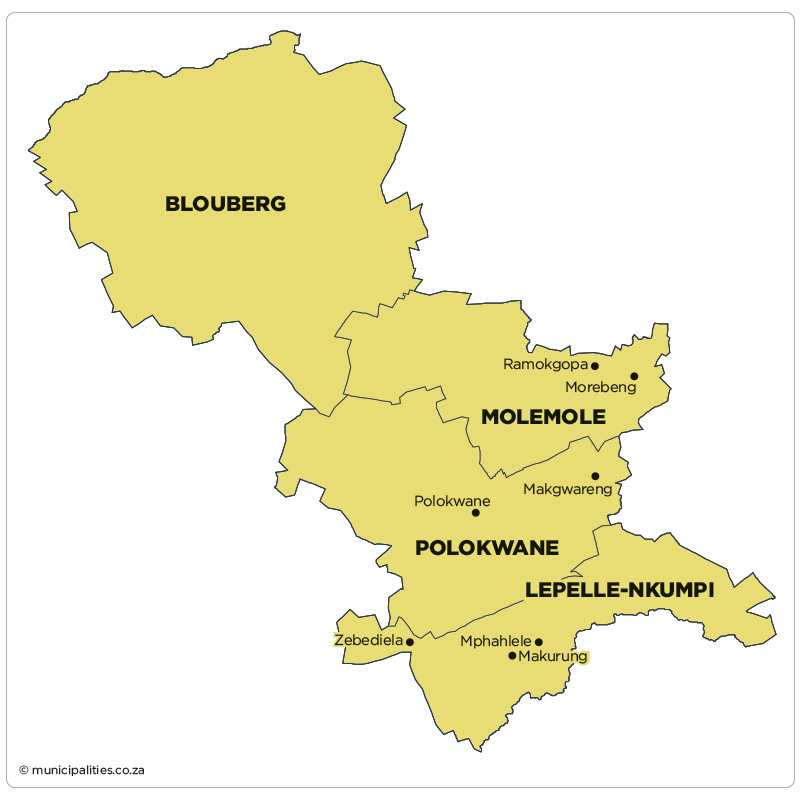
Map
Council & Management
Composition of Council:
ANC 33, EFF 7, COPE 2, ABC 1, DA 1
Controlling Party:
ANC
Mayor:
Ms Maria Thamaga (ANC)
Deputy Mayor:
n/a
Speaker:
Mr Phineas Boloka (ANC)
Chief Whip:
Ms Johanna Rangata
Other Council:
Ms Raseruthe Agnes (Chairperson: Infrastructure Development)
Mr Robert Makobela (Chairperson: Finance)
Mr Daniel Mosena (Chairperson: Economic Development and Planning)
Mr Prince Motswabe (Chairperson: Corporate Services)
Mr C Phoshoko
Ms Shirley Raphasha (Chairperson: Community Services)
Mr Martin Tlouamma
Municipal Manager:
Mr RJ Ramothwala
Chief Financial Officer:
Ms Mulatwa Thangavhuelelo
Senior Management:
Mr Robert Mdaka (Director: Corporate Services)
Mr Potedi Mphateng (Director: Community Services)
Communications Officers:
Mr Sodi Magomane
Demographic Information
| 2022 | 2016 | 2011 | |
| Population | 192 109 | 172 601 | 175 085 |
| Age Structure | |||
| Population under 15 | 35.0% | 40.0% | 38.9% |
| Population 15 to 64 | 56.5% | 53.0% | 53.5% |
| Population over 65 | 8.5% | 7.0% | 7.6% |
| Dependency Ratio | |||
| Per 100 (15-64) | 77.0 | 88.5 | 87.0 |
| Sex Ratio | |||
| Males per 100 females | 84.4 | 82.1 | 83.5 |
| Population Growth | |||
| Per annum | 0.90% | -0.32% | n/a |
| Labour Market | |||
| Unemployment rate (official) | n/a | n/a | n/a |
| Youth unemployment rate (official) 15-34 | n/a | n/a | n/a |
| Education (aged 20 +) | |||
| No schooling | 20.4% | 19.5% | 27.4% |
| Matric | n/a | 18.9% | 15.7% |
| Higher education | 5.6% | 6.0% | 5.0% |
| Household Dynamics | |||
| Households | 57 575 | 43 747 | 44 673 |
| Average household size | 3.3 | 3.9 | 3.9 |
| Female headed households | n/a | 57.3% | 56.3% |
| Formal dwellings | 96.5% | 95.6% | 93.3% |
| Housing owned | n/a | 65.4% | 57.2% |
| Household Services | |||
| Flush toilet connected to sewerage | 30.9% | 5.5% | 7.0% |
| Weekly refuse removal | 33.3% | 16.6% | 19.3% |
| Piped water inside dwelling | 32.7% | 1.4% | 7.8% |
| Electricity for lighting | 97.7% | 95.2% | 88.0% |
Financial Results
| All values: R'000 | 2024/25 | 2023/24 | 2022/23 | 2021/22 | 2020/21 |
| AUDIT OUTCOME | n/a | Qualified audit | Qualified audit | Financially unqualified | Financially unqualified |
| FINANCIAL PERFORMANCE | |||||
| Property rates | 73 176 | 68 961 | 25 229 | 29 497 | 27 550 |
| Service charges | 44 100 | 37 519 | 33 877 | 31 039 | 30 264 |
| Investment revenue | 7 421 | 7 844 | 4 112 | 2 019 | 1 536 |
| Transfers recognised - operational | 251 677 | 241 376 | 225 391 | 214 163 | 239 283 |
| Other own revenue | 18 411 | 18 027 | 31 523 | 12 851 | 7 332 |
| Total Revenue (excluding capital transfers and contributions) | 394 785 | 373 726 | 320 133 | 289 569 | 305 964 |
| Employee costs | 146 080 | 132 265 | 124 044 | 119 858 | 115 511 |
| Remuneration of councillors | 19 780 | 19 213 | 17 982 | 17 214 | 16 412 |
| Depreciation and amortisation | 69 751 | 65 893 | 35 158 | 30 421 | 29 419 |
| Finance charges | 4 343 | 4 442 | - | - | - |
| Inventory consumed and bulk purchases | 76 197 | 65 679 | 54 659 | 52 721 | 38 802 |
| Transfers and subsidies | - | - | - | 50 | - |
| Other expenditure | 150 944 | 89 439 | 182 037 | 103 731 | 108 577 |
| Total Expenditure | 467 096 | 376 930 | 413 880 | 323 995 | 308 722 |
| Surplus/(Deficit) | (72 310) | (3 203) | (93 748) | (34 426) | (2 757) |
| Transfers and subsidies - capital (monetary allocations) | 114 213 | 95 457 | 112 528 | 62 602 | 55 896 |
| Transfers and subsidies - capital (in-kind) | - | - | - | - | - |
| Surplus/(Deficit) after capital transfers & contributions | 41 903 | 92 253 | 18 780 | 28 176 | 53 139 |
| Share of surplus/(deficit) of associate | - | - | - | - | - |
| Surplus/(Deficit) for the year | 41 903 | 92 253 | 18 780 | 28 176 | 53 139 |
| CAPITAL EXPENDITURE & FUNDS SOURCES | |||||
| Capital expenditure | 105 978 | 84 579 | 524 | 8 074 | 5 444 |
| Transfers recognised - capital | 99 962 | 83 484 | - | - | 26 |
| Borrowing | - | - | - | - | - |
| Internally generated funds | 6 017 | 1 094 | 524 | 8 074 | 5 418 |
| Total sources of capital funds | 105 978 | 84 579 | 524 | 8 074 | 5 444 |
| FINANCIAL POSITION | |||||
| Total current assets | 232 540 | 286 071 | 157 302 | 189 118 | 161 275 |
| Total non current assets | 1 539 334 | 1 499 415 | 1 076 476 | 986 552 | 951 986 |
| Total current liabilities | 144 620 | 200 841 | 113 649 | 89 480 | 58 691 |
| Total non current liabilities | 20 335 | 19 629 | 40 779 | 26 570 | 23 126 |
| Community wealth/Equity | 1 727 039 | 1 569 349 | 1 025 116 | 1 074 662 | 1 025 015 |
| CASH FLOWS | |||||
| Net cash from (used) operating | (139 624) | 119 778 | (131 677) | (52 470) | 115 994 |
| Net cash from (used) investing | (102 693) | (89 554) | (750) | (8 074) | (2 871) |
| Net cash from (used) financing | (1 179) | 6 538 | - | - | - |
| Cash/cash equivalents at the year end | (57 096) | 138 605 | (47 593) | (19 214) | 154 630 |
| UNAUTHORISED, IRREGULAR, FRUITLESS & WASTEFUL EXPENDITURE | |||||
| Unauthorised expenditure | n/a | - | - | 7 087 | - |
| Irregular expenditure | n/a | 34 654 | 4 702 | 8 338 | 30 286 |
| Fruitless & wasteful expenditure | n/a | - | - | - | - |
| SOURCE | Audited Outcome A1 2026 Q1 | Audited Outcome A1 2026 Q1 | Audited Outcome A1 2026 Q1 | Audited Outcome A1 2024 | Audited Outcome A1 2023 |
Employment Statistics
| 2022/23 | 2021/22 | 2020/21 | 2019/20 | 2018/19 | |
| Employment | |||||
| Employment Costs (R’000) | 124 044 | 119 858 | 115 511 | 110 376 | 103 613 |
| Remuneration of councillors (R’000) | 17 982 | 17 214 | 16 412 | 16 976 | 16 187 |
| Total Employee Positions | 321 | 230 | 195 | 198 | 268 |
| Total Vacant Employee Positions | 96 | 14 | 7 | 6 | 57 |
| Total Vacancy Percentage | 29.91% | 6.09% | 3.59% | 3.03% | 21.27% |
| Managerial Positions – S54A and S56 | 6 | 6 | 6 | 6 | 6 |
| Vacant Managerial Positions – S54A and S56 | 4 | 2 | 0 | 0 | 1 |
| Managerial Positions - by organogram | 33 | 33 | 32 | 32 | 25 |
| Vacant Managerial Positions - by organogram | 4 | 6 | 7 | 6 | 0 |
Service Delivery Statistics
| 2022/23 | 2021/22 | 2020/21 | 2019/20 | 2018/19 | |
| Water | |||||
| Does the municipality provide? | No | No | No | No | No |
| Number of households and non-domestic customers to which provided | 0 | 0 | 0 | 0 | 0 |
| Number of domestic households/delivery points | 0 | 0 | 0 | 0 | 0 |
| Inside the yard | 0 | 0 | 0 | 0 | 0 |
| Less than 200m from yard | 0 | 0 | 0 | 0 | 0 |
| More than 200m from yard | 0 | 0 | 0 | 0 | 0 |
| Domestic households with access to free basic service | 0 | 0 | 0 | 0 | 0 |
| Electricity | |||||
| Does the municipality provide? | Yes | Yes | Yes | Yes | Yes |
| Number of households and non-domestic customers to which provided | 43 423 | 43 344 | 43 010 | 43 010 | 43 010 |
| Domestic households with access to free basic service | 129 | 129 | 4 834 | 4 834 | 2 530 |
| Sewerage and Sanitation | |||||
| Does the municipality provide? | No | No | No | No | No |
| Number of households and non-domestic customers to which provided | 0 | 0 | 0 | 0 | 0 |
| Number of households using: | |||||
| Flush toilet - public sewerage | 0 | 0 | 0 | 0 | 0 |
| Flush toilet - septic tank | 0 | 0 | 0 | 0 | 0 |
| Ventilated pit latrine | 0 | 0 | 0 | 0 | 0 |
| Bucket system | 0 | 0 | 0 | 0 | 0 |
| Other | 0 | 0 | 0 | 0 | 0 |
| Domestic households with access to free basic service | 0 | 0 | 0 | 0 | 0 |
| Solid Waste Services | |||||
| Does the municipality provide? | Yes | Yes | Yes | Yes | Yes |
| Number of households and non-domestic customers to which provided | 7 598 | 7 598 | 7 598 | 7 598 | 7 598 |
| Domestic households with access to free basic service | 129 | 129 | 4 834 | 4 834 | 6 965 |