 B
B
Municipalities
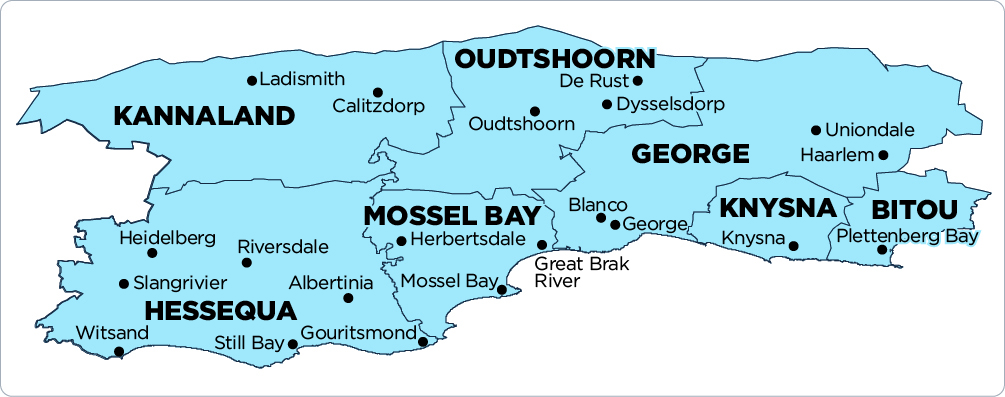
Bitou Local Municipality (WC047)
Metropolitan, district, and local municipalities across South Africa.
WC047
Active
https://www.bitou.gov.za
Overview
Bitou Local Municipality (WC047) delivers municipal services and manages local development planning and governance within its jurisdiction. It supports community infrastructure, local regulation and administration, and service delivery functions that enable daily life and economic activity. This profile provides a structured reference for key municipal information.
Map
Council & Management
Composition of Council:
DA 5, ANC 4, AUF 1, IPM 1, PA 1, PDC 1
Controlling Party:
DA/IPM/AUF Coalition
Mayor:
Ms Jessica Kamkam (DA)
Deputy Mayor:
Ms Nokuzola Kolwapi (IPM)
Speaker:
Ms Mavis Busakwe (AUF)
Chief Whip:
Ms Annelise Oliver (MMC)
Other Council:
Mrs Katrina De Bruin
Mr JN Kamkam (MMC)
Mr Thembela Mhlana
Willem Nel (MMC)
Ms Renicia Willemse (MPAC Chairperson)
Municipal Manager:
Mr Chris Mapeyi (Acting)
Mr Mbulelo Memani (Suspended)
Chief Financial Officer:
Mr Christopher Mapeyi
Senior Management:
Mr Alan Croutz (Manager: Legal Services)
Mr Victor Felton (Director: Engineering Services)
Mr Thembinkosi Henge (Manager: IDP)
Mr Carlos Koeberg (Chief Audit Executive)
Mr Luvuyo Loliwe (Director: Corporate Services)
Mr Fezile Maki (Manager: Integrated Human Settlements)
Mrs Jennifer Mussa (Council Support)
Mr Alan Paulse (Manager: Governance and Compliance)
Mrs Carol van Standen (Chief Risk Officer)
Mr Siyasanga Vandala (Acting Director: Community Services)
Communications Officers:
Mr Andile Namtu (Manager: Corporate Communications, IGR, and Public)
Demographic Information
| 2022 | 2016 | 2011 | |
| Population | 65 240 | 59 157 | 49 162 |
| Age Structure | |||
| Population under 15 | 22.5% | 25.4% | 25.2% |
| Population 15 to 64 | 69.0% | 68.5% | 68.4% |
| Population over 65 | 8.5% | 6.1% | 6.4% |
| Dependency Ratio | |||
| Per 100 (15-64) | 45.0 | 46.0 | 46.1 |
| Sex Ratio | |||
| Males per 100 females | 94.2 | 100.1 | 99.1 |
| Population Growth | |||
| Per annum | 2.75% | 4.21% | n/a |
| Labour Market | |||
| Unemployment rate (official) | n/a | n/a | 30.1% |
| Youth unemployment rate (official) 15-34 | n/a | n/a | 37.9% |
| Education (aged 20 +) | |||
| No schooling | 2.1% | 2.0% | 2.4% |
| Matric | n/a | 32.5% | 28.2% |
| Higher education | 14.3% | 9.2% | 11.7% |
| Household Dynamics | |||
| Households | 21 848 | 21 914 | 16 645 |
| Average household size | 3.0 | 2.7 | 3.0 |
| Female headed households | n/a | 35.4% | 33.5% |
| Formal dwellings | 85.4% | 76.6% | 72.2% |
| Housing owned | n/a | 66.2% | 45.9% |
| Household Services | |||
| Flush toilet connected to sewerage | 97.3% | 89.0% | 84.0% |
| Weekly refuse removal | 85.2% | 88.6% | 87.7% |
| Piped water inside dwelling | 80.0% | 59.3% | 58.5% |
| Electricity for lighting | 98.6% | 98.7% | 94.0% |
Financial Results
| All values: R'000 | 2024/25 | 2023/24 | 2022/23 | 2021/22 | 2020/21 |
| AUDIT OUTCOME | n/a | Financially unqualified | Clean audit | Financially unqualified | Financially unqualified |
| FINANCIAL PERFORMANCE | |||||
| Property rates | 196 255 | 178 229 | 151 413 | 157 194 | 149 321 |
| Service charges | 487 906 | 431 020 | 420 558 | 401 993 | 374 427 |
| Investment revenue | 17 396 | 13 198 | 8 035 | 3 747 | 6 601 |
| Transfers recognised - operational | 170 940 | 173 026 | 155 970 | 140 026 | 149 138 |
| Other own revenue | 127 449 | 120 740 | 103 971 | 96 366 | 57 355 |
| Total Revenue (excluding capital transfers and contributions) | 999 946 | 916 213 | 839 947 | 799 325 | 736 842 |
| Employee costs | 322 315 | 313 617 | 286 329 | 278 100 | 266 759 |
| Remuneration of councillors | 7 512 | 7 376 | 6 721 | 6 198 | 6 250 |
| Depreciation and amortisation | 37 325 | 48 851 | 36 393 | 36 135 | 35 696 |
| Finance charges | 24 211 | 20 922 | 19 740 | 11 102 | 13 399 |
| Inventory consumed and bulk purchases | 250 202 | 214 280 | 177 949 | 174 666 | 160 591 |
| Transfers and subsidies | 9 221 | 9 208 | 5 626 | 4 527 | 5 571 |
| Other expenditure | 278 260 | 268 253 | 264 037 | 288 952 | 275 290 |
| Total Expenditure | 929 045 | 882 508 | 796 795 | 799 680 | 763 556 |
| Surplus/(Deficit) | 70 901 | 33 705 | 43 151 | (355) | (26 715) |
| Transfers and subsidies - capital (monetary allocations) | 89 640 | 50 307 | 36 567 | 48 270 | 33 032 |
| Transfers and subsidies - capital (in-kind) | - | 33 | - | 325 | - |
| Surplus/(Deficit) after capital transfers & contributions | 160 541 | 84 045 | 79 718 | 48 240 | 6 317 |
| Share of surplus/(deficit) of associate | - | - | - | - | - |
| Surplus/(Deficit) for the year | 160 541 | 84 045 | 79 718 | 48 240 | 6 317 |
| CAPITAL EXPENDITURE & FUNDS SOURCES | |||||
| Capital expenditure | 134 346 | 104 311 | 84 807 | 79 574 | 79 203 |
| Transfers recognised - capital | 78 862 | 44 924 | 33 505 | 60 306 | 28 991 |
| Borrowing | 30 737 | 35 920 | 32 098 | - | 11 805 |
| Internally generated funds | 24 747 | 23 434 | 19 203 | 18 943 | 38 406 |
| Total sources of capital funds | 134 346 | 104 279 | 84 806 | 79 249 | 79 203 |
| FINANCIAL POSITION | |||||
| Total current assets | 369 976 | 292 020 | 450 113 | 341 997 | 309 745 |
| Total non current assets | 1 430 646 | 1 334 569 | 1 255 346 | 1 219 004 | 1 173 689 |
| Total current liabilities | 165 214 | 181 136 | 391 277 | 359 377 | 255 308 |
| Total non current liabilities | 221 615 | 192 202 | 162 293 | 134 689 | 213 822 |
| Community wealth/Equity | 1 413 793 | 1 253 284 | 1 151 922 | 1 066 943 | 1 007 987 |
| CASH FLOWS | |||||
| Net cash from (used) operating | (972 454) | (769 631) | (308 562) | 188 467 | 28 367 |
| Net cash from (used) investing | (152 028) | (114 140) | (72 382) | 10 375 | (748) |
| Net cash from (used) financing | (1 352) | - | - | - | - |
| Cash/cash equivalents at the year end | (960 407) | (788 693) | (332 316) | 272 307 | 153 336 |
| UNAUTHORISED, IRREGULAR, FRUITLESS & WASTEFUL EXPENDITURE | |||||
| Unauthorised expenditure | n/a | 31 764 | - | 1 231 121 | 35 294 |
| Irregular expenditure | n/a | 21 876 | 175 | 73 235 | 44 080 |
| Fruitless & wasteful expenditure | n/a | 1 162 | 75 | 4 466 | 103 |
| SOURCE | Audited Outcome A1 2026 Q1 | Audited Outcome A1 2026 Q1 | Audited Outcome A1 2026 Q1 | Audited Outcome A1 2024 | Audited Outcome A1 2023 |
Employment Statistics
| 2022/23 | 2021/22 | 2020/21 | 2019/20 | 2018/19 | |
| Employment | |||||
| Employment Costs (R’000) | 286 329 | 278 100 | 266 759 | 227 170 | 171 580 |
| Remuneration of councillors (R’000) | 6 721 | 6 198 | 6 250 | 5 908 | 5 840 |
| Total Employee Positions | 705 | 638 | 638 | 622 | 637 |
| Total Vacant Employee Positions | 81 | 3 | 1 | 2 | 87 |
| Total Vacancy Percentage | 11.49% | 0.47% | 0.16% | 0.32% | 13.66% |
| Managerial Positions – S54A and S56 | 6 | 6 | 6 | 6 | 6 |
| Vacant Managerial Positions – S54A and S56 | 3 | 3 | 1 | 2 | 1 |
| Managerial Positions - by organogram | 40 | 40 | 40 | 40 | 36 |
| Vacant Managerial Positions - by organogram | 0 | 0 | 0 | 0 | 1 |
Service Delivery Statistics
| 2022/23 | 2021/22 | 2020/21 | 2019/20 | 2018/19 | |
| Water | |||||
| Does the municipality provide? | Yes | Yes | Yes | Yes | Yes |
| Number of households and non-domestic customers to which provided | 23 949 | 21 851 | 21 634 | 21 628 | 20 961 |
| Number of domestic households/delivery points | 23 516 | 21 418 | 21 201 | 21 195 | 20 528 |
| Inside the yard | 22 838 | 20 781 | 20 564 | 20 558 | 17 992 |
| Less than 200m from yard | 678 | 637 | 637 | 637 | 2 536 |
| More than 200m from yard | 0 | 0 | 0 | 0 | 0 |
| Domestic households with access to free basic service | 4 132 | 3 404 | 3 931 | 2 357 | 4 381 |
| Electricity | |||||
| Does the municipality provide? | Yes | Yes | Yes | Yes | Yes |
| Number of households and non-domestic customers to which provided | 18 374 | 18 305 | 18 205 | 18 205 | 17 678 |
| Domestic households with access to free basic service | 4 132 | 3 404 | 3 931 | 7 430 | 4 381 |
| Sewerage and Sanitation | |||||
| Does the municipality provide? | Yes | Yes | Yes | Yes | Yes |
| Number of households and non-domestic customers to which provided | 23 706 | 23 132 | 23 120 | 23 116 | 20 151 |
| Number of households using: | |||||
| Flush toilet - public sewerage | 21 057 | 20 544 | 20 532 | 20 528 | 17 563 |
| Flush toilet - septic tank | 2 228 | 2 174 | 2 174 | 2 174 | 2 174 |
| Ventilated pit latrine | 35 | 35 | 35 | 35 | 35 |
| Bucket system | 0 | 0 | 0 | 0 | 0 |
| Other | 35 | 28 | 28 | 28 | 28 |
| Domestic households with access to free basic service | 4 132 | 3 404 | 3 931 | 2 357 | 4 381 |
| Solid Waste Services | |||||
| Does the municipality provide? | Yes | Yes | Yes | Yes | Yes |
| Number of households and non-domestic customers to which provided | 22 160 | 20 357 | 20 357 | 23 000 | 23 000 |
| Domestic households with access to free basic service | 4 132 | 3 404 | 3 931 | 2 357 | 4 831 |