 B
B
Municipalities
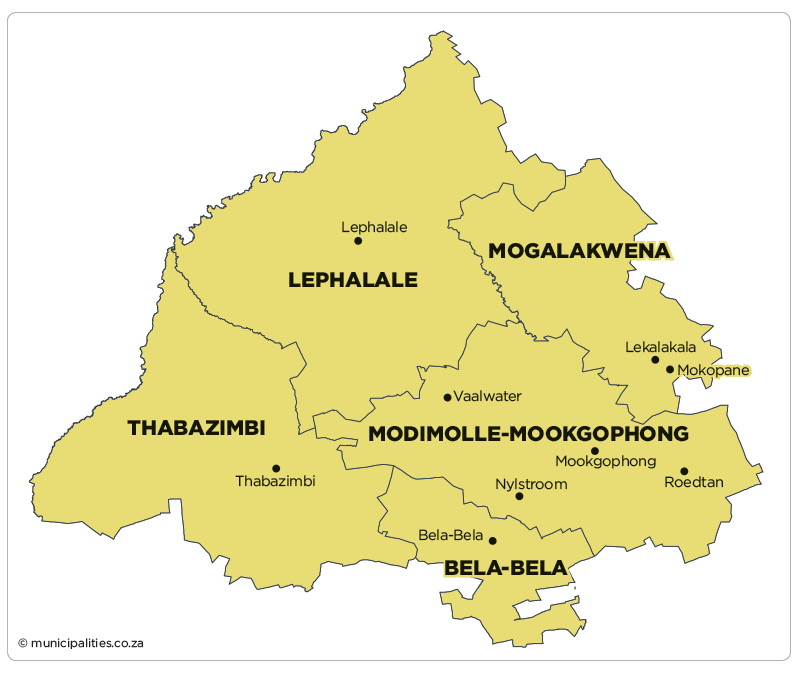
Bela-Bela Local Municipality (LIM366)
Metropolitan, district, and local municipalities across South Africa.
LIM366
Active
https://www.belabela.gov.za
Overview
Bela-Bela Local Municipality (LIM366) delivers local government services and manages development priorities within its municipal boundary. It oversees municipal administration, service delivery coordination, and local planning processes that shape community infrastructure and economic activity. This profile consolidates public reference information for the municipality.
Map
Council & Management
Composition of Council:
ANC 10, DA 2, EFF 2, VF PLUS 2, BRA 1
Controlling Party:
ANC
Mayor:
Ms Gloria Seleka (ANC)
Deputy Mayor:
n/a
Speaker:
Ms Tholaphi Nelly Zikhali (ANC)
Chief Whip:
Mr Koos Sepuru
Other Council:
Ms Mary Koover (Exco Member)
Municipal Manager:
Mr Tsatsi George Ramagaga
Chief Financial Officer:
Mr Ramadiga Malvin Marutha
Senior Management:
Ms Dikala Sarah Malope (Social and Community Services)
Ms Hlekane Betty Maswanganyi (Senior Manager: Technical Services)
Mr Nkhangweleni Siliga (Planning and Economic Development)
Communications Officers:
Ms Khensani Makwakwa (Acting: Media Liaison Officer)
Mr David Raborolo (Acting: Divisional Manager)
Demographic Information
| 2022 | 2016 | 2011 | |
| Population | 64 306 | 76 296 | 66 500 |
| Age Structure | |||
| Population under 15 | 23.9% | 33.0% | 28.1% |
| Population 15 to 64 | 67.7% | 61.8% | 66.0% |
| Population over 65 | 8.4% | 5.3% | 5.9% |
| Dependency Ratio | |||
| Per 100 (15-64) | 47.7 | 61.9 | 51.6 |
| Sex Ratio | |||
| Males per 100 females | 97.9 | 104.4 | 103.1 |
| Population Growth | |||
| Per annum | -0.33% | 3.12% | n/a |
| Labour Market | |||
| Unemployment rate (official) | n/a | n/a | 22.5% |
| Youth unemployment rate (official) 15-34 | n/a | n/a | 29.8% |
| Education (aged 20 +) | |||
| No schooling | 5.9% | 4.1% | 9.7% |
| Matric | n/a | 32.5% | 26.2% |
| Higher education | 10.8% | 9.4% | 9.1% |
| Household Dynamics | |||
| Households | 22 449 | 21 354 | 18 068 |
| Average household size | 2.9 | 3.6 | 3.7 |
| Female headed households | n/a | 39.3% | 37.5% |
| Formal dwellings | 88.7% | 89.7% | 86.3% |
| Housing owned | n/a | 52.5% | 43.7% |
| Household Services | |||
| Flush toilet connected to sewerage | 79.5% | 64.9% | 79.0% |
| Weekly refuse removal | 70.0% | 62.2% | 64.2% |
| Piped water inside dwelling | 55.4% | 27.8% | 41.9% |
| Electricity for lighting | 83.5% | 86.0% | 85.0% |
Financial Results
| All values: R'000 | 2024/25 | 2023/24 | 2022/23 | 2021/22 | 2020/21 |
| AUDIT OUTCOME | n/a | Qualified audit | Qualified audit | Qualified audit | Qualified audit |
| FINANCIAL PERFORMANCE | |||||
| Property rates | 107 614 | 95 606 | 108 940 | 81 022 | 79 461 |
| Service charges | 239 932 | 220 633 | 189 890 | 189 393 | 178 992 |
| Investment revenue | 4 789 | 2 752 | 1 432 | 189 | 95 |
| Transfers recognised - operational | 144 522 | 134 834 | 122 766 | 109 019 | 119 288 |
| Other own revenue | 161 755 | 92 172 | 89 675 | 64 324 | 41 034 |
| Total Revenue (excluding capital transfers and contributions) | 658 611 | 545 998 | 512 704 | 443 947 | 418 870 |
| Employee costs | 169 460 | 147 682 | 143 621 | 152 101 | 151 948 |
| Remuneration of councillors | 9 034 | 8 810 | 7 835 | 7 248 | 7 509 |
| Depreciation and amortisation | 44 080 | 42 206 | 41 711 | 50 691 | 37 706 |
| Finance charges | 7 517 | 15 351 | 17 502 | 8 597 | 4 618 |
| Inventory consumed and bulk purchases | 184 281 | 161 452 | 138 631 | 151 075 | 122 338 |
| Transfers and subsidies | - | - | - | - | - |
| Other expenditure | 262 528 | 172 188 | 96 628 | 113 580 | 308 157 |
| Total Expenditure | 676 900 | 547 689 | 445 929 | 483 292 | 632 275 |
| Surplus/(Deficit) | (18 289) | (1 691) | 66 776 | (39 345) | (213 406) |
| Transfers and subsidies - capital (monetary allocations) | 131 124 | 89 986 | 83 242 | 69 232 | 73 298 |
| Transfers and subsidies - capital (in-kind) | 52 437 | 16 744 | - | - | - |
| Surplus/(Deficit) after capital transfers & contributions | 165 273 | 105 039 | 150 018 | 29 887 | (140 107) |
| Share of surplus/(deficit) of associate | - | - | - | - | - |
| Surplus/(Deficit) for the year | 165 273 | 105 039 | 150 018 | 29 887 | (140 107) |
| CAPITAL EXPENDITURE & FUNDS SOURCES | |||||
| Capital expenditure | 167 964 | 111 886 | 72 021 | 47 636 | 80 590 |
| Transfers recognised - capital | 114 413 | 77 646 | 56 747 | 61 875 | 76 461 |
| Borrowing | - | - | - | - | - |
| Internally generated funds | 13 673 | 17 496 | 15 075 | (14 834) | 4 151 |
| Total sources of capital funds | 128 086 | 95 142 | 71 822 | 47 041 | 80 612 |
| FINANCIAL POSITION | |||||
| Total current assets | 421 584 | 315 655 | 262 355 | 195 785 | 112 209 |
| Total non current assets | 1 130 172 | 997 588 | 920 297 | 1 101 451 | 956 064 |
| Total current liabilities | 341 406 | 253 843 | 245 809 | 276 357 | 266 786 |
| Total non current liabilities | 141 717 | 163 647 | 151 647 | 124 758 | 89 957 |
| Community wealth/Equity | 1 068 633 | 895 753 | 751 491 | 909 871 | 889 883 |
| CASH FLOWS | |||||
| Net cash from (used) operating | 155 388 | 175 889 | 221 356 | 174 839 | 327 990 |
| Net cash from (used) investing | (127 725) | (95 319) | (77 680) | (64 795) | (70 830) |
| Net cash from (used) financing | - | - | - | - | - |
| Cash/cash equivalents at the year end | 52 930 | 91 809 | 157 783 | 122 560 | 849 144 |
| UNAUTHORISED, IRREGULAR, FRUITLESS & WASTEFUL EXPENDITURE | |||||
| Unauthorised expenditure | n/a | 58 368 | 35 089 | 168 311 | 70 996 |
| Irregular expenditure | n/a | 26 501 | 67 457 | 75 521 | 14 448 |
| Fruitless & wasteful expenditure | n/a | 211 | 4 471 | 12 142 | 834 |
| SOURCE | Audited Outcome A1 2026 Q1 | Audited Outcome A1 2026 Q1 | Audited Outcome A1 2026 Q1 | Audited Outcome A1 2024 | Audited Outcome A1 2023 |
Employment Statistics
| 2022/23 | 2021/22 | 2020/21 | 2019/20 | 2018/19 | |
| Employment | |||||
| Employment Costs (R’000) | 143 621 | 152 101 | 151 948 | 149 584 | 119 514 |
| Remuneration of councillors (R’000) | 7 835 | 7 248 | 7 509 | 7 072 | 7 364 |
| Total Employee Positions | 410 | 409 | 365 | 597 | 506 |
| Total Vacant Employee Positions | 66 | 63 | 10 | 193 | 157 |
| Total Vacancy Percentage | 16.10% | 15.40% | 2.74% | 32.33% | 31.03% |
| Managerial Positions – S54A and S56 | 6 | 6 | 6 | 6 | 6 |
| Vacant Managerial Positions – S54A and S56 | 2 | 1 | 1 | 0 | 1 |
| Managerial Positions - by organogram | 29 | 29 | 30 | 30 | 29 |
| Vacant Managerial Positions - by organogram | 9 | 10 | 9 | 7 | 7 |
Service Delivery Statistics
| 2022/23 | 2021/22 | 2020/21 | 2019/20 | 2018/19 | |
| Water | |||||
| Does the municipality provide? | Yes | Yes | Yes | Yes | Yes |
| Number of households and non-domestic customers to which provided | 24 073 | 22 743 | 22 743 | 21 854 | 21 773 |
| Number of domestic households/delivery points | 23 655 | 22 325 | 22 325 | 21 435 | 21 354 |
| Inside the yard | 20 648 | 18 570 | 18 570 | 17 695 | 17 614 |
| Less than 200m from yard | 1 713 | 3 755 | 3 755 | 3 740 | 3 740 |
| More than 200m from yard | 1 294 | 0 | 0 | 0 | 0 |
| Domestic households with access to free basic service | 5 201 | 4 932 | 4 331 | 4 294 | 4 838 |
| Electricity | |||||
| Does the municipality provide? | Yes | Yes | Yes | Yes | Yes |
| Number of households and non-domestic customers to which provided | 21 582 | 21 174 | 21 174 | 21 174 | 21 121 |
| Domestic households with access to free basic service | 5 201 | 5 041 | 4 374 | 4 294 | 3 452 |
| Sewerage and Sanitation | |||||
| Does the municipality provide? | Yes | Yes | Yes | Yes | Yes |
| Number of households and non-domestic customers to which provided | 23 803 | 23 658 | 23 656 | 23 091 | 20 127 |
| Number of households using: | |||||
| Flush toilet - public sewerage | 18 610 | 18 554 | 18 554 | 17 654 | 17 654 |
| Flush toilet - septic tank | 1 481 | 1 481 | 1 481 | 1 098 | 1 098 |
| Ventilated pit latrine | 3 042 | 2 260 | 2 260 | 1 420 | 1 060 |
| Bucket system | 0 | 0 | 0 | 0 | 0 |
| Other | 350 | 1 043 | 1 043 | 2 605 | 0 |
| Domestic households with access to free basic service | 5 201 | 4 932 | 3 533 | 4 262 | 4 793 |
| Solid Waste Services | |||||
| Does the municipality provide? | Yes | Yes | Yes | Yes | Yes |
| Number of households and non-domestic customers to which provided | 17 511 | 17 511 | 17 511 | 16 611 | 16 611 |
| Domestic households with access to free basic service | 5 201 | 4 041 | 3 503 | 4 283 | 4 829 |