 B
B
Municipalities
Ba-Phalaborwa Local Municipality (LIM334)
Metropolitan, district, and local municipalities across South Africa.
LIM334
Active
https://www.phalaborwa.gov.za
Overview
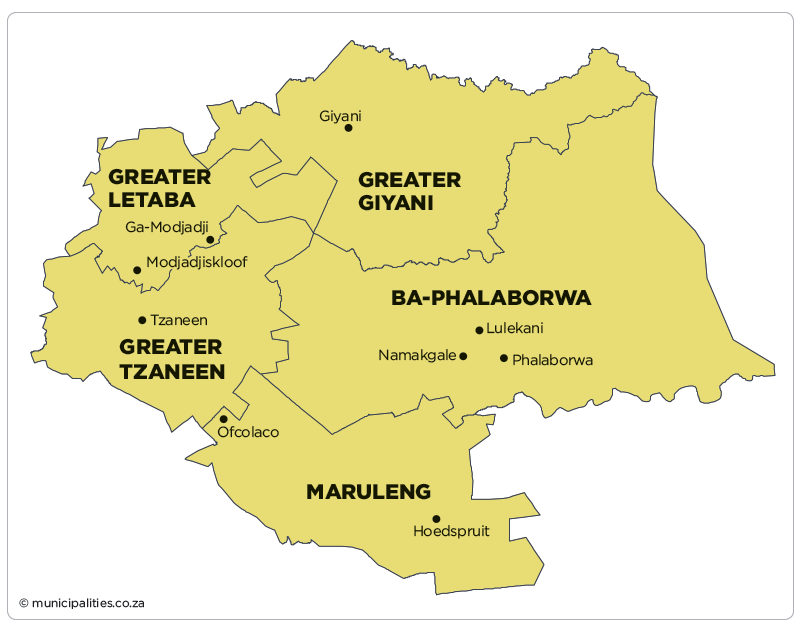
Ba-Phalaborwa Local Municipality (LIM334) provides local government services and manages local development within its municipal area. It is responsible for municipal administration, service delivery functions, and planning processes that shape local infrastructure and community outcomes. This profile consolidates key reference information for residents and stakeholders.
Map
Council & Management
Composition of Council:
ANC 24, EFF 5, DA 4, NIP 2, MIM 1, VF PLUS 1
Controlling Party:
ANC
Mayor:
Ms Merriam Malatji (ANC)
Deputy Mayor:
n/a
Speaker:
Mr Oliver Mabunda (ANC)
Chief Whip:
Ms Didodo Mary Rapatsa
Other Council:
Mr Sobrant de Beer (Chairperson: Community and Social Services)
Mrs Mokgadi Paulina Mailula (Chairperson: Planning and Development)
Mr Richard Makasela (Chairperson: Finance)
Mr Pontsho Mashumu (Exco Member)
Mr Thompson Nkuna (Chairperson: Corporate Services)
Mr Victor Rapatsa (Chairperson: Technical Services)
Ms Jamela Selapyane (Acting)
Municipal Manager:
Ms ST Mokobi
Chief Financial Officer:
Mr A Nzimande
Senior Management:
Mr T Hlongwane
Mr MC Mashale (Manager: LED)
Ms Motlalepula Mphachoe
Ms JB Selapyyane
Communications Officers:
Mr Jonas Mahesu (Municipal Spokesperson)
Demographic Information
| 2022 | 2016 | 2011 | |
| Population | 188 603 | 168 937 | 150 637 |
| Age Structure | |||
| Population under 15 | 31.8% | 31.4% | 32.9% |
| Population 15 to 64 | 63.2% | 65.2% | 63.2% |
| Population over 65 | 5.0% | 3.4% | 3.9% |
| Dependency Ratio | |||
| Per 100 (15-64) | 58.1 | 53.3 | 58.2 |
| Sex Ratio | |||
| Males per 100 females | 91.8 | 95.2 | 94.1 |
| Population Growth | |||
| Per annum | 2.18% | 2.61% | n/a |
| Labour Market | |||
| Unemployment rate (official) | n/a | n/a | 37.4% |
| Youth unemployment rate (official) 15-34 | n/a | n/a | 50.2% |
| Education (aged 20 +) | |||
| No schooling | 14.3% | 12.9% | 14.6% |
| Matric | n/a | 30.6% | 23.3% |
| Higher education | 10.0% | 9.2% | 11.0% |
| Household Dynamics | |||
| Households | 51 651 | 49 100 | 41 114 |
| Average household size | 3.7 | 3.4 | 3.7 |
| Female headed households | n/a | 38.9% | 39.5% |
| Formal dwellings | 98.1% | 96.7% | 96.4% |
| Housing owned | n/a | 77.0% | 61.6% |
| Household Services | |||
| Flush toilet connected to sewerage | 48.8% | 36.8% | 42.6% |
| Weekly refuse removal | 43.2% | 42.2% | 48.8% |
| Piped water inside dwelling | 41.0% | 30.6% | 37.1% |
| Electricity for lighting | 97.7% | 98.1% | 90.8% |
Financial Results
| All values: R'000 | 2024/25 | 2023/24 | 2022/23 | 2021/22 | 2020/21 |
| AUDIT OUTCOME | n/a | Qualified audit | Qualified audit | Qualified audit | Qualified audit |
| FINANCIAL PERFORMANCE | |||||
| Property rates | 128 877 | 127 740 | 135 075 | 133 398 | 95 114 |
| Service charges | 149 243 | 137 825 | 138 523 | 131 390 | 121 622 |
| Investment revenue | 4 881 | 5 120 | 4 026 | 2 434 | 2 718 |
| Transfers recognised - operational | 223 452 | 215 659 | 196 070 | 182 025 | 205 154 |
| Other own revenue | 79 171 | 66 927 | 88 426 | 107 701 | 206 134 |
| Total Revenue (excluding capital transfers and contributions) | 585 624 | 553 272 | 562 120 | 556 948 | 630 743 |
| Employee costs | 179 827 | 167 310 | 172 122 | 165 677 | 143 244 |
| Remuneration of councillors | 17 260 | 16 987 | 18 189 | 17 262 | 15 304 |
| Depreciation and amortisation | 49 456 | 43 073 | 47 422 | 86 780 | 84 208 |
| Finance charges | 22 144 | 22 902 | 20 847 | 18 266 | 18 641 |
| Inventory consumed and bulk purchases | 180 212 | 162 442 | 129 620 | 130 847 | 103 886 |
| Transfers and subsidies | 214 | 10 676 | 7 390 | 9 854 | - |
| Other expenditure | 312 844 | 394 498 | 51 936 | 197 672 | 129 128 |
| Total Expenditure | 761 957 | 817 887 | 447 526 | 626 360 | 494 412 |
| Surplus/(Deficit) | (176 333) | (264 615) | 114 594 | (69 411) | 136 331 |
| Transfers and subsidies - capital (monetary allocations) | 35 105 | 49 065 | 42 559 | 47 155 | 49 099 |
| Transfers and subsidies - capital (in-kind) | - | 51 703 | 332 | 11 899 | - |
| Surplus/(Deficit) after capital transfers & contributions | (141 228) | (163 847) | 157 484 | (10 357) | 185 430 |
| Share of surplus/(deficit) of associate | - | - | - | - | - |
| Surplus/(Deficit) for the year | (141 228) | (163 847) | 157 484 | (10 357) | 185 430 |
| CAPITAL EXPENDITURE & FUNDS SOURCES | |||||
| Capital expenditure | 40 973 | 140 761 | 51 980 | 89 087 | - |
| Transfers recognised - capital | 26 265 | 49 986 | 15 293 | 10 687 | - |
| Borrowing | - | - | - | - | - |
| Internally generated funds | 14 707 | 90 775 | 36 687 | 78 400 | - |
| Total sources of capital funds | 40 973 | 140 761 | 51 980 | 89 087 | - |
| FINANCIAL POSITION | |||||
| Total current assets | 2 057 160 | 1 912 579 | 1 928 073 | 1 436 888 | 1 267 535 |
| Total non current assets | 1 280 728 | 1 266 906 | 1 247 008 | 1 244 502 | 1 268 041 |
| Total current liabilities | 2 362 771 | 2 134 030 | 1 939 056 | 1 763 971 | 1 448 713 |
| Total non current liabilities | 210 641 | 190 907 | 201 940 | 217 855 | 216 315 |
| Community wealth/Equity | 905 703 | 1 018 395 | 876 602 | 709 923 | 685 118 |
| CASH FLOWS | |||||
| Net cash from (used) operating | (70 092) | 537 023 | 65 079 | 890 155 | - |
| Net cash from (used) investing | (36 950) | (68 780) | (19 232) | - | - |
| Net cash from (used) financing | (19 017) | 1 293 | (17 642) | - | - |
| Cash/cash equivalents at the year end | (73 054) | 526 255 | 84 925 | 959 475 | 69 320 |
| UNAUTHORISED, IRREGULAR, FRUITLESS & WASTEFUL EXPENDITURE | |||||
| Unauthorised expenditure | n/a | 84 816 | - | 61 590 | 27 120 |
| Irregular expenditure | n/a | 20 879 | 21 969 | 40 549 | 28 554 |
| Fruitless & wasteful expenditure | n/a | 7 194 | 183 | 509 | 87 |
| SOURCE | Audited Outcome A1 2026 Q1 | Audited Outcome A1 2026 Q1 | Audited Outcome A1 2026 Q1 | Audited Outcome A1 2024 | Audited Outcome A1 2023 |
Employment Statistics
| 2022/23 | 2021/22 | 2020/21 | 2019/20 | 2018/19 | |
| Employment | |||||
| Employment Costs (R’000) | 172 122 | 165 677 | 143 244 | 147 649 | 128 892 |
| Remuneration of councillors (R’000) | 18 189 | 17 262 | 15 304 | 18 850 | 17 227 |
| Total Employee Positions | 653 | 503 | 468 | 442 | 644 |
| Total Vacant Employee Positions | 248 | 2 | 3 | 1 | 221 |
| Total Vacancy Percentage | 37.98% | 0.40% | 0.64% | 0.23% | 34.32% |
| Managerial Positions – S54A and S56 | 6 | 6 | 6 | 6 | 6 |
| Vacant Managerial Positions – S54A and S56 | 0 | 1 | 0 | 0 | 0 |
| Managerial Positions - by organogram | 22 | 16 | 19 | 19 | 20 |
| Vacant Managerial Positions - by organogram | 0 | 0 | 3 | 1 | 1 |
Service Delivery Statistics
| 2022/23 | 2021/22 | 2020/21 | 2019/20 | 2018/19 | |
| Water | |||||
| Does the municipality provide? | No | No | No | No | No |
| Number of households and non-domestic customers to which provided | 0 | 0 | 0 | 0 | 0 |
| Number of domestic households/delivery points | 0 | 0 | 0 | 0 | 0 |
| Inside the yard | 0 | 0 | 0 | 0 | 0 |
| Less than 200m from yard | 0 | 0 | 0 | 0 | 0 |
| More than 200m from yard | 0 | 0 | 0 | 0 | 0 |
| Domestic households with access to free basic service | 0 | 0 | 0 | 0 | 0 |
| Electricity | |||||
| Does the municipality provide? | Yes | Yes | Yes | Yes | Yes |
| Number of households and non-domestic customers to which provided | 51 879 | 51 318 | 46 087 | 45 995 | 45 995 |
| Domestic households with access to free basic service | 419 | 421 | 823 | 423 | 1 269 |
| Sewerage and Sanitation | |||||
| Does the municipality provide? | No | No | No | No | No |
| Number of households and non-domestic customers to which provided | 0 | 0 | 0 | 0 | 0 |
| Number of households using: | |||||
| Flush toilet - public sewerage | 0 | 0 | 0 | 0 | 0 |
| Flush toilet - septic tank | 0 | 0 | 0 | 0 | 0 |
| Ventilated pit latrine | 0 | 0 | 0 | 0 | 0 |
| Bucket system | 0 | 0 | 0 | 0 | 0 |
| Other | 0 | 0 | 0 | 0 | 0 |
| Domestic households with access to free basic service | 0 | 0 | 0 | 0 | 0 |
| Solid Waste Services | |||||
| Does the municipality provide? | Yes | Yes | Yes | Yes | Yes |
| Number of households and non-domestic customers to which provided | 23 941 | 23 941 | 22 941 | 22 941 | 22 941 |
| Domestic households with access to free basic service | 334 | 252 | 523 | 423 | 423 |