 A
A
Municipalities
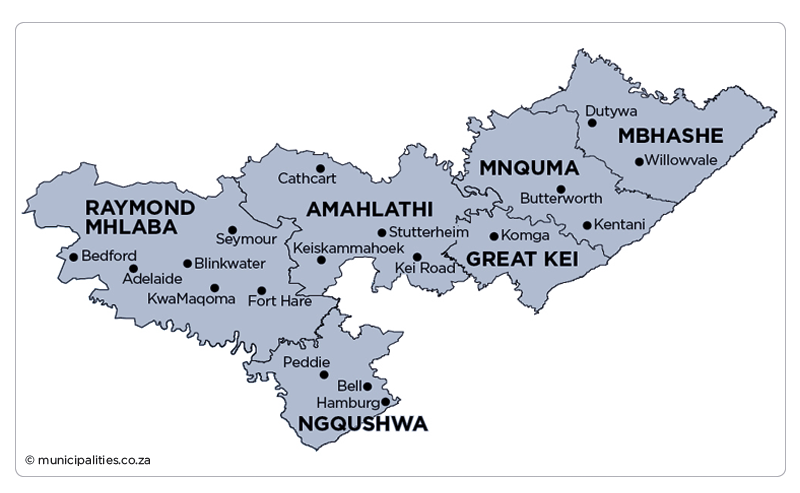
Amathole District Municipality (DC12)
Metropolitan, district, and local municipalities across South Africa.
DC12
Active
https://www.amathole.co.za
Overview
Amathole District Municipality (DC12) is a district authority that supports regional planning and service delivery coordination across its constituent local municipalities. It contributes to integrated development planning, infrastructure coordination, and programmes that benefit from district-level scale and shared capacity. This profile summarises the municipality’s governance context and provides a public reference point for key details.
Geography, History & Economy
- Amahlathi Local Municipality
- Great Kei Local Municipality
- Mbhashe Local Municipality
- Mnquma Local Municipality
- Ngqushwa Local Municipality
- Raymond Mhlaba Local Municipality
Map
Council & Management
Composition of Council:
ANC 14, EFF 2, ATM 1, DA 1, UDM 1 (40% PR Seats)
Controlling Party:
ANC
Mayor:
Anele Ntsangani (ANC)
Speaker:
Onke Mgunculu (ANC)
Chief Whip:
Nanziwe Rulashe
Other Council:
Celiwe Genyane (MMC: Legislative and Executive Support)
Nomonde Geza (MMC: Engineering and Infrastructure Services)
Bandile Ketelo (MMC: Strategic Planning and Management)
Bukelwa Madikane (MMC: Corporate and Human Resource Management)
Khanyile Maneli (MMC: Community Services)
Xhanti Mngxaso (MMC: Spatial Planning and Economic Development)
Fumanekile Phumaphi (MMC: Budget and Treasury)
Municipal Manager:
Dr Bhekisisa Mthembu
Chief Financial Officer:
Mr Ncecile Zengethwa
Senior Management:
Dr Vuyokazi Dlelaphantsi (Director: Corporate Services)
Dr Makhosandile Kwaza (Chief Audit Executive)
Ms Nokuthula Mgijima-Zondani (Director: Community Services)
Ms Nombasa Msebi (Director: Engineering Services)
Mr Luyanda Sovasi (Director: Strategic and Planning Management)
Mr Zolile Vumazonke (Senior Legal Practioner)
Ms Zolisa Cynthia Xabadiya (Director: Land, Human Settlements and Economic Development)
Communications Officers:
Ms Sisa Msiwa (Acting Senior Manager: Communications and Customer Care)
Demographic Information
| 2022 | 2016 | 2011 | |
| Population | 871 601 | 880 790 | 854 967 |
| Age Structure | |||
| Population under 15 | 29.3% | 32.7% | 33.5% |
| Population 15 to 64 | 60.4% | 61.6% | 57.6% |
| Population over 65 | 10.4% | 5.7% | 8.9% |
| Dependency Ratio | |||
| Per 100 (15-64) | 65.7 | 62.4 | 73.6 |
| Sex Ratio | |||
| Males per 100 females | 90.9 | 89.6 | 88.5 |
| Population Growth | |||
| Per annum | 0.19% | 0.65% | n/a |
| Labour Market | |||
| Unemployment rate (official) | n/a | n/a | n/a |
| Youth unemployment rate (official) 15-34 | n/a | n/a | n/a |
| Education (aged 20 +) | |||
| No schooling | 9.2% | 10.2% | 13.6% |
| Matric | n/a | 19.0% | 13.2% |
| Higher education | 7.2% | 5.7% | 6.1% |
| Household Dynamics | |||
| Households | 241 612 | 213 763 | 227 572 |
| Average household size | 3.6 | 4.1 | 3.8 |
| Female headed households | n/a | 52.2% | 53.0% |
| Formal dwellings | 81.1% | 55.9% | 52.7% |
| Housing owned | n/a | 71.2% | 67.8% |
| Household Services | |||
| Flush toilet connected to sewerage | 40.1% | 17.0% | 18.1% |
| Weekly refuse removal | 35.4% | 17.4% | 16.5% |
| Piped water inside dwelling | 34.6% | 12.3% | 12.6% |
| Electricity for lighting | 94.5% | 82.4% | 69.8% |
Financial Results
| All values: R'000 | 2024/25 | 2023/24 | 2022/23 | 2021/22 | 2020/21 |
| AUDIT OUTCOME | n/a | Qualified audit | Disclaimer of audit | Disclaimer of audit | Adverse audit |
| FINANCIAL PERFORMANCE | |||||
| Property rates | - | - | - | - | - |
| Service charges | 691 561 | (113 992) | 483 170 | 525 698 | 416 669 |
| Investment revenue | 37 834 | 8 440 | 24 834 | 12 795 | 9 447 |
| Transfers recognised - operational | 664 242 | (104 685) | 997 918 | 730 617 | 973 614 |
| Other own revenue | 664 648 | 10 569 | 69 144 | 504 130 | 120 908 |
| Total Revenue (excluding capital transfers and contributions) | 2 058 285 | (199 669) | 1 575 066 | 1 773 240 | 1 520 638 |
| Employee costs | 659 034 | 25 084 | 659 221 | 679 639 | 726 734 |
| Remuneration of councillors | 17 401 | 2 976 | 14 367 | 14 716 | 16 234 |
| Depreciation and amortisation | 282 773 | 260 327 | 8 064 | 95 396 | 180 485 |
| Finance charges | 36 340 | 21 046 | 21 837 | 15 721 | 7 400 |
| Inventory consumed and bulk purchases | 444 238 | 166 108 | 42 809 | 59 778 | (174 896) |
| Transfers and subsidies | 15 498 | 145 | 10 000 | 9 946 | 15 600 |
| Other expenditure | 722 446 | 320 328 | 677 904 | 769 192 | 1 073 813 |
| Total Expenditure | 2 177 731 | 796 015 | 1 434 201 | 1 644 388 | 1 845 369 |
| Surplus/(Deficit) | (119 446) | (995 684) | 140 864 | 128 852 | (324 731) |
| Transfers and subsidies - capital (monetary allocations) | 651 278 | 154 928 | 189 283 | 332 765 | 492 618 |
| Transfers and subsidies - capital (in-kind) | - | - | - | - | - |
| Surplus/(Deficit) after capital transfers & contributions | 531 831 | (840 756) | 330 147 | 461 617 | 167 887 |
| Share of surplus/(deficit) of associate | - | - | - | - | - |
| Surplus/(Deficit) for the year | 531 831 | (840 756) | 330 147 | 461 617 | 167 887 |
| CAPITAL EXPENDITURE & FUNDS SOURCES | |||||
| Capital expenditure | 381 432 | 11 028 900 | 180 465 | 245 141 | 224 476 |
| Transfers recognised - capital | 353 325 | (3 972 028) | 121 064 | 252 764 | (153 024) |
| Borrowing | - | - | - | - | - |
| Internally generated funds | - | - | - | - | - |
| Total sources of capital funds | 353 325 | (3 972 028) | 121 064 | 252 764 | (153 024) |
| FINANCIAL POSITION | |||||
| Total current assets | 1 504 299 | 304 960 | 884 499 | 820 799 | 765 809 |
| Total non current assets | 10 292 899 | 9 901 921 | 5 207 864 | 4 516 379 | 4 597 400 |
| Total current liabilities | 1 122 239 | 1 163 933 | 1 105 865 | 4 728 431 | 902 777 |
| Total non current liabilities | 200 923 | 201 094 | 181 530 | 144 554 | 176 923 |
| Community wealth/Equity | 9 942 205 | 9 682 611 | 4 474 821 | 2 577 | 4 115 622 |
| CASH FLOWS | |||||
| Net cash from (used) operating | 5 044 124 | 267 169 | 1 477 360 | 344 903 | 356 055 |
| Net cash from (used) investing | - | - | - | - | 0 |
| Net cash from (used) financing | - | - | - | - | (136) |
| Cash/cash equivalents at the year end | 5 271 785 | 663 441 | 1 703 239 | 435 734 | 550 089 |
| UNAUTHORISED, IRREGULAR, FRUITLESS & WASTEFUL EXPENDITURE | |||||
| Unauthorised expenditure | n/a | 188 649 | 36 796 | 69 438 | - |
| Irregular expenditure | n/a | 639 289 | 223 054 | 46 749 | 39 233 |
| Fruitless & wasteful expenditure | n/a | 28 182 | 21 699 | 61 394 | 6 960 |
| SOURCE | Audited Outcome A1 2026 Q1 | Audited Outcome A1 2026 Q1 | Audited Outcome A1 2026 Q1 | Audited Outcome A1 2024 | Audited Outcome A1 2023 |
Employment Statistics
| 2022/23 | 2021/22 | 2020/21 | 2019/20 | 2018/19 | |
| Employment | |||||
| Employment Costs (R’000) | 659 221 | 679 639 | 726 734 | 734 907 | 628 296 |
| Remuneration of councillors (R’000) | 14 367 | 14 716 | 16 234 | 15 015 | 15 242 |
| Total Employee Positions | 2 298 | 1 536 | 3 107 | 2 299 | 1 605 |
| Total Vacant Employee Positions | 916 | 123 | 876 | 781 | 344 |
| Total Vacancy Percentage | 39.86% | 8.01% | 28.19% | 33.97% | 21.43% |
| Managerial Positions – S54A and S56 | 7 | 7 | 8 | 8 | 7 |
| Vacant Managerial Positions – S54A and S56 | 3 | 2 | 2 | 1 | 2 |
| Managerial Positions - by organogram | 226 | 226 | 237 | 237 | 156 |
| Vacant Managerial Positions - by organogram | 104 | 121 | 89 | 89 | 20 |
Service Delivery Statistics
| 2022/23 | 2021/22 | 2020/21 | 2019/20 | 2018/19 | |
| Water | |||||
| Does the municipality provide? | Yes | Yes | Yes | Yes | Yes |
| Number of households and non-domestic customers to which provided | 282 322 | 282 322 | 327 463 | 245 003 | 245 003 |
| Number of domestic households/delivery points | 281 486 | 281 486 | 326 627 | 244 167 | 244 167 |
| Inside the yard | 56 289 | 56 289 | 54 305 | 36 069 | 36 069 |
| Less than 200m from yard | 184 646 | 184 646 | 184 646 | 202 100 | 202 100 |
| More than 200m from yard | 40 551 | 40 551 | 87 676 | 5 998 | 5 998 |
| Domestic households with access to free basic service | 1 597 | 1 613 | 1 613 | 1 613 | 34 617 |
| Electricity | |||||
| Does the municipality provide? | No | No | No | No | No |
| Number of households and non-domestic customers to which provided | 0 | 0 | 0 | 0 | 0 |
| Domestic households with access to free basic service | 0 | 0 | 0 | 0 | 0 |
| Sewerage and Sanitation | |||||
| Does the municipality provide? | Yes | Yes | Yes | Yes | Yes |
| Number of households and non-domestic customers to which provided | 311 181 | 308 707 | 229 689 | 229 689 | 192 516 |
| Number of households using: | |||||
| Flush toilet - public sewerage | 42 762 | 42 762 | 23 882 | 23 882 | 23 882 |
| Flush toilet - septic tank | 0 | 0 | 0 | 0 | 0 |
| Ventilated pit latrine | 267 583 | 265 109 | 204 971 | 204 971 | 167 699 |
| Bucket system | 0 | 0 | 0 | 0 | 0 |
| Other | 0 | 0 | 0 | 0 | 0 |
| Domestic households with access to free basic service | 1 597 | 1 613 | 1 613 | 1 613 | 34 617 |
| Solid Waste Services | |||||
| Does the municipality provide? | No | No | No | No | No |
| Number of households and non-domestic customers to which provided | 0 | 0 | 0 | 0 | 0 |
| Domestic households with access to free basic service | 0 | 0 | 0 | 0 | 0 |