 A
A
Municipalities
Amajuba District Municipality (DC25)
Metropolitan, district, and local municipalities across South Africa.
DC25
Active
https://www.amajuba.gov.za
Overview
Amajuba District Municipality (DC25) coordinates district-wide planning and supports service delivery and development across its local municipalities. It plays a role in regional infrastructure planning, integrated development coordination, and shared services where district capacity strengthens outcomes. This profile consolidates public reference information to clarify the district’s governance role and functions.
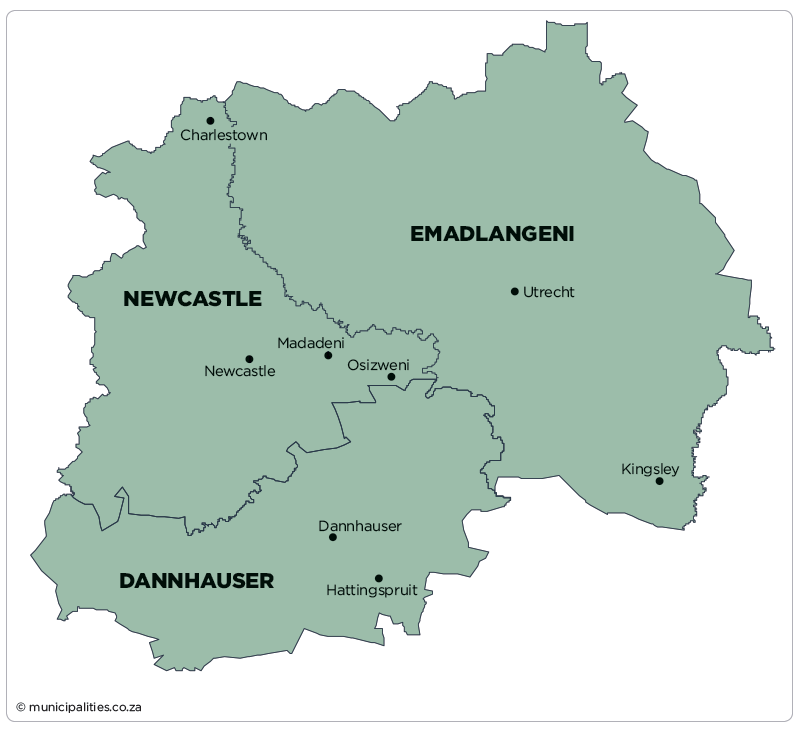
Geography, History & Economy
- Dannhauser Local Municipality
- eMadlangeni Local Municipality
- Newcastle Local Municipality
Map
Council & Management
Composition of Council:
ANC 4, IFP 4, EFF 2, DA 1, TSSA 1 (40% PR Seats)
Controlling Party:
n/a
Mayor:
Mr Thembelihle Mthembu (IFP)
Deputy Mayor:
Mr Shaka Sithole (IFP)
Speaker:
Mr Siphamandla Zulu (IFP)
Chief Whip:
Mr Andile Nkosi
Other Council:
Ms Phumzile Mgcina (Exco)
Ms Jabu Phakathi (Exco)
Mr S Sizani (Exco)
Municipal Manager:
Mrs Adelaide Dlamini
Chief Financial Officer:
Mr Mduduzi Mngomezulu
Senior Management:
SC Mdakane (Director: Community Services)
C Myeza (Director: Planning and Development Services)
Mr Sihlangu Ngobese (Manager: LED)
Mr Joseph Thusi (NAMPAC)
TW Zulu (Director: Engineering Services)
Communications Officers:
Mr Sbonelo Cebekhulu
Demographic Information
| 2022 | 2016 | 2011 | |
| Population | 687 408 | 531 327 | 500 615 |
| Age Structure | |||
| Population under 15 | 28.9% | 35.4% | 33.7% |
| Population 15 to 64 | 65.3% | 60.9% | 61.7% |
| Population over 65 | 5.9% | 3.7% | 4.7% |
| Dependency Ratio | |||
| Per 100 (15-64) | 53.2 | 64.3 | 62.2 |
| Sex Ratio | |||
| Males per 100 females | 92.6 | 91.5 | 91.4 |
| Population Growth | |||
| Per annum | 3.08% | 1.35% | n/a |
| Labour Market | |||
| Unemployment rate (official) | n/a | n/a | n/a |
| Youth unemployment rate (official) 15-34 | n/a | n/a | n/a |
| Education (aged 20 +) | |||
| No schooling | 5.3% | 6.1% | 8.0% |
| Matric | n/a | 36.6% | 30.9% |
| Higher education | 11.3% | 9.0% | 9.0% |
| Household Dynamics | |||
| Households | 150 239 | 117 256 | 111 103 |
| Average household size | 4.6 | 4.5 | 4.5 |
| Female headed households | n/a | 48.4% | 47.6% |
| Formal dwellings | 93.5% | 84.4% | 87.6% |
| Housing owned | n/a | 62.6% | 50.2% |
| Household Services | |||
| Flush toilet connected to sewerage | 65.1% | 52.0% | 48.1% |
| Weekly refuse removal | 62.7% | 53.8% | 57.4% |
| Piped water inside dwelling | 51.9% | 37.3% | 43.1% |
| Electricity for lighting | 94.8% | 92.0% | 83.7% |
Financial Results
| All values: R'000 | 2024/25 | 2023/24 | 2022/23 | 2021/22 | 2020/21 |
| AUDIT OUTCOME | n/a | Qualified audit | Qualified audit | Qualified audit | Qualified audit |
| FINANCIAL PERFORMANCE | |||||
| Property rates | - | - | - | - | - |
| Service charges | 32 472 | 27 665 | 35 587 | 34 719 | 28 113 |
| Investment revenue | 8 054 | 10 321 | 7 333 | 3 757 | 3 722 |
| Transfers recognised - operational | 230 109 | 221 152 | 216 822 | 190 002 | 192 781 |
| Other own revenue | 7 951 | 30 729 | 17 817 | 24 427 | 10 126 |
| Total Revenue (excluding capital transfers and contributions) | 278 585 | 289 867 | 277 559 | 252 906 | 234 742 |
| Employee costs | 150 962 | 140 141 | 126 825 | 113 237 | 75 483 |
| Remuneration of councillors | 9 366 | 9 250 | 8 753 | 7 013 | 7 216 |
| Depreciation and amortisation | 23 125 | 20 840 | 16 968 | 15 312 | 9 276 |
| Finance charges | 7 434 | 5 274 | 3 311 | 437 | 571 |
| Inventory consumed and bulk purchases | 27 708 | 24 535 | 20 502 | 29 047 | 28 051 |
| Transfers and subsidies | - | 6 | 43 | 1 160 | 855 |
| Other expenditure | 183 684 | 154 739 | 146 283 | 117 804 | 139 297 |
| Total Expenditure | 402 279 | 354 786 | 322 684 | 284 009 | 260 749 |
| Surplus/(Deficit) | (123 693) | (64 919) | (45 125) | (31 103) | (26 008) |
| Transfers and subsidies - capital (monetary allocations) | 172 745 | 103 771 | 91 495 | 88 996 | 100 217 |
| Transfers and subsidies - capital (in-kind) | - | - | - | - | - |
| Surplus/(Deficit) after capital transfers & contributions | 49 052 | 38 852 | 46 370 | 57 893 | 74 209 |
| Share of surplus/(deficit) of associate | 17 468 | (3 471) | 32 286 | - | - |
| Surplus/(Deficit) for the year | 66 520 | 35 381 | 78 656 | 57 893 | 74 209 |
| CAPITAL EXPENDITURE & FUNDS SOURCES | |||||
| Capital expenditure | 133 248 | 368 285 | 363 952 | 273 167 | 190 227 |
| Transfers recognised - capital | 133 027 | 174 215 | 224 998 | 238 691 | 170 285 |
| Borrowing | - | - | - | - | - |
| Internally generated funds | 1 057 | 83 307 | 28 198 | 21 207 | 19 894 |
| Total sources of capital funds | 134 084 | 257 522 | 253 196 | 259 898 | 190 179 |
| FINANCIAL POSITION | |||||
| Total current assets | 86 986 | 106 957 | 117 159 | 99 656 | 92 056 |
| Total non current assets | 866 714 | 800 232 | 732 808 | 691 082 | 653 551 |
| Total current liabilities | 203 857 | 195 208 | 177 146 | 133 158 | 113 785 |
| Total non current liabilities | 8 519 | 2 237 | 3 574 | 5 071 | 6 320 |
| Community wealth/Equity | 709 740 | 667 421 | 655 162 | 598 092 | 580 679 |
| CASH FLOWS | |||||
| Net cash from (used) operating | (43 705) | (110 873) | (196 510) | (221 271) | (106 567) |
| Net cash from (used) investing | - | - | - | - | - |
| Net cash from (used) financing | - | (1 838) | (1 838) | - | - |
| Cash/cash equivalents at the year end | 18 402 | (73 741) | (159 378) | (221 268) | (17 345) |
| UNAUTHORISED, IRREGULAR, FRUITLESS & WASTEFUL EXPENDITURE | |||||
| Unauthorised expenditure | n/a | 53 934 | 84 170 | 782 103 | 64 898 |
| Irregular expenditure | n/a | 26 392 | 59 027 | 62 441 | 199 647 |
| Fruitless & wasteful expenditure | n/a | 3 329 | 3 393 | 2 407 | 3 151 |
| SOURCE | Audited Outcome A1 2026 Q1 | Audited Outcome A1 2026 Q1 | Audited Outcome A1 2026 Q1 | Audited Outcome A1 2024 | Audited Outcome A1 2023 |
Employment Statistics
| 2022/23 | 2021/22 | 2020/21 | 2019/20 | 2018/19 | |
| Employment | |||||
| Employment Costs (R’000) | 126 825 | 113 237 | 75 483 | 94 999 | 91 341 |
| Remuneration of councillors (R’000) | 8 753 | 7 013 | 7 216 | 6 181 | 6 032 |
| Total Employee Positions | 245 | 203 | 254 | 257 | 245 |
| Total Vacant Employee Positions | 71 | 24 | 76 | 83 | 71 |
| Total Vacancy Percentage | 28.98% | 11.82% | 29.92% | 32.30% | 28.98% |
| Managerial Positions – S54A and S56 | 6 | 6 | 6 | 6 | 6 |
| Vacant Managerial Positions – S54A and S56 | 1 | 1 | 1 | 2 | 1 |
| Managerial Positions - by organogram | 51 | 63 | 63 | 63 | 51 |
| Vacant Managerial Positions - by organogram | 12 | 18 | 18 | 24 | 12 |
Service Delivery Statistics
| 2022/23 | 2021/22 | 2020/21 | 2019/20 | 2018/19 | |
| Water | |||||
| Does the municipality provide? | Yes | Yes | Yes | Yes | Yes |
| Number of households and non-domestic customers to which provided | 33 440 | 30 085 | 30 067 | 26 970 | 24 797 |
| Number of domestic households/delivery points | 33 150 | 29 795 | 29 795 | 26 689 | 24 516 |
| Inside the yard | 12 138 | 8 783 | 8 783 | 5 677 | 5 510 |
| Less than 200m from yard | 15 226 | 15 226 | 15 226 | 15 226 | 13 220 |
| More than 200m from yard | 5 786 | 5 786 | 5 786 | 5 786 | 5 786 |
| Domestic households with access to free basic service | 256 | 245 | 5 510 | 5 510 | 5 510 |
| Electricity | |||||
| Does the municipality provide? | No | No | No | No | No |
| Number of households and non-domestic customers to which provided | 0 | 0 | 0 | 0 | 0 |
| Domestic households with access to free basic service | 0 | 0 | 0 | 0 | 0 |
| Sewerage and Sanitation | |||||
| Does the municipality provide? | Yes | Yes | Yes | Yes | Yes |
| Number of households and non-domestic customers to which provided | 25 196 | 25 171 | 25 153 | 23 208 | 23 208 |
| Number of households using: | |||||
| Flush toilet - public sewerage | 8 406 | 5 727 | 5 727 | 2 621 | 2 621 |
| Flush toilet - septic tank | 1 200 | 1 200 | 1 200 | 2 352 | 2 352 |
| Ventilated pit latrine | 15 300 | 17 954 | 17 954 | 17 954 | 17 954 |
| Bucket system | 0 | 0 | 0 | 0 | 0 |
| Other | 0 | 0 | 0 | 0 | 0 |
| Domestic households with access to free basic service | 256 | 245 | 5 510 | 0 | 0 |
| Solid Waste Services | |||||
| Does the municipality provide? | No | No | No | No | No |
| Number of households and non-domestic customers to which provided | 0 | 0 | 0 | 0 | 0 |
| Domestic households with access to free basic service | 0 | 0 | 0 | 0 | 0 |