 A
A
Municipalities
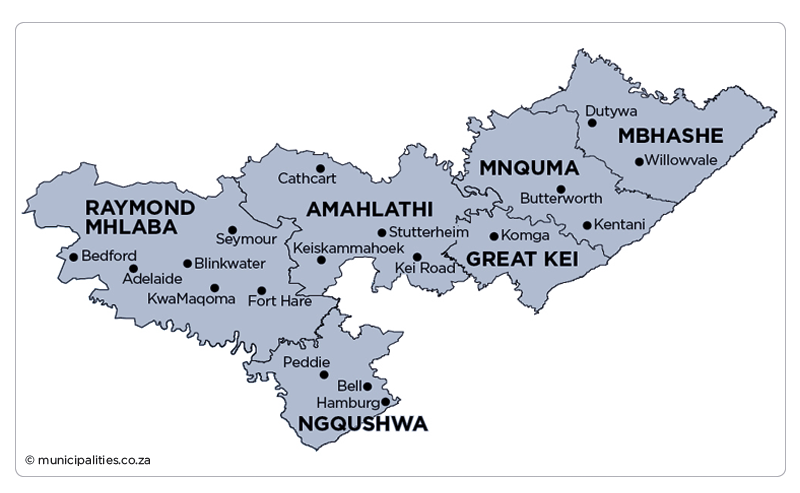
Amahlathi Local Municipality (EC124)
Metropolitan, district, and local municipalities across South Africa.
EC124
Active
https://amahlathi.gov.za
Overview
Amahlathi Local Municipality (EC124) is responsible for delivering municipal services and managing local development priorities within its jurisdiction. It oversees community-facing administration, local planning, and governance systems that support service delivery and economic activity. This profile provides a structured reference for key municipal information and context.
Map
Council & Management
Composition of Council:
ANC 24, DA 3, EFF 2, APC 1
Controlling Party:
ANC
Mayor:
Ms Nomakhosazana Nongqayi (ANC)
Deputy Mayor:
n/a
Speaker:
Mrs Nokuzola Mlahleki (ANC)
Chief Whip:
Mrs Pateka Qaba
Other Council:
Ms Nobathembu Angeline Kato-Manyika (Portfolio Head: Budget and Treasury Office)
Mr Richard Pickering (Portfolio Head: Community Services)
Mr Xola Moses Tokwe (Portfolio Head: Engineering Services)
Mr Busisa Xongwana (Portfolio Head: Development and Planning)
Administrator:
Dr Sindisile Maclean
Municipal Manager:
Dr Zamuxolo Shasha
Chief Financial Officer:
Mrs Buyiswa Ngwendu
Senior Management:
Mrs Nonkqubela Dlova (Director: Engineering)
Mr Simphiwe Mnweba (Director: Development and Planning)
Ms Andiswa Noholoza (Director: Community Services)
Ms Nozuko Nqulo (Director: Corporate Services)
Communications Officers:
Ms Pamella Gavini (Secretary to Municipal Manager)
Ms Sandy Kleinhans (Secretary to the Speaker)
Siyabulela Mbi (Secretary to the Mayor)
Ms Anathi Nyoka
Demographic Information
| 2022 | 2016 | 2011 | |
| Population | 115 703 | 101 826 | 101 035 |
| Age Structure | |||
| Population under 15 | 27.8% | 31.5% | 30.7% |
| Population 15 to 64 | 62.7% | 63.3% | 60.9% |
| Population over 65 | 9.5% | 5.2% | 8.4% |
| Dependency Ratio | |||
| Per 100 (15-64) | 59.4 | 58.0 | 64.2 |
| Sex Ratio | |||
| Males per 100 females | 95.3 | 93.2 | 91.8 |
| Population Growth | |||
| Per annum | 1.32% | 0.18% | n/a |
| Labour Market | |||
| Unemployment rate (official) | n/a | n/a | n/a |
| Youth unemployment rate (official) 15-34 | n/a | n/a | n/a |
| Education (aged 20 +) | |||
| No schooling | 7.1% | 5.4% | 10.1% |
| Matric | n/a | 20.2% | 13.9% |
| Higher education | 6.1% | 4.8% | 4.8% |
| Household Dynamics | |||
| Households | 33 621 | 24 577 | 28 357 |
| Average household size | 3.4 | 4.1 | 3.6 |
| Female headed households | n/a | 47.2% | 48.0% |
| Formal dwellings | 84.3% | 53.1% | 61.5% |
| Housing owned | n/a | 75.2% | 68.9% |
| Household Services | |||
| Flush toilet connected to sewerage | 46.4% | 21.6% | 26.5% |
| Weekly refuse removal | 39.7% | 14.0% | 24.6% |
| Piped water inside dwelling | 38.3% | 13.7% | 18.4% |
| Electricity for lighting | 94.8% | 92.0% | 82.4% |
Financial Results
| All values: R'000 | 2024/25 | 2023/24 | 2022/23 | 2021/22 | 2020/21 |
| AUDIT OUTCOME | n/a | Financially unqualified | Qualified audit | Financially unqualified | Financially unqualified |
| FINANCIAL PERFORMANCE | |||||
| Property rates | 22 003 | 24 169 | 23 331 | 22 178 | 20 576 |
| Service charges | 75 469 | 59 021 | 47 020 | 49 713 | 49 448 |
| Investment revenue | 3 421 | 3 456 | 1 613 | 366 | 1 001 |
| Transfers recognised - operational | 146 325 | 138 142 | 130 339 | 121 776 | 144 141 |
| Other own revenue | 59 696 | 41 824 | 23 358 | 17 220 | 13 502 |
| Total Revenue (excluding capital transfers and contributions) | 306 914 | 266 611 | 225 661 | 211 253 | 228 668 |
| Employee costs | 124 980 | 136 206 | 135 383 | 123 339 | 132 726 |
| Remuneration of councillors | 14 006 | 13 595 | 13 662 | 11 533 | 11 599 |
| Depreciation and amortisation | 41 062 | 25 940 | 26 030 | 26 049 | 25 570 |
| Finance charges | 7 069 | 15 524 | 10 047 | 2 536 | 3 802 |
| Inventory consumed and bulk purchases | 59 491 | 51 988 | 43 364 | 43 061 | 36 188 |
| Transfers and subsidies | - | 10 | 10 | - | - |
| Other expenditure | 70 673 | 61 198 | 68 555 | 27 718 | 66 080 |
| Total Expenditure | 317 281 | 304 461 | 297 053 | 234 236 | 275 965 |
| Surplus/(Deficit) | (10 367) | (37 850) | (71 393) | (22 983) | (47 297) |
| Transfers and subsidies - capital (monetary allocations) | 77 657 | 46 078 | 32 255 | 28 300 | 52 932 |
| Transfers and subsidies - capital (in-kind) | - | - | - | - | - |
| Surplus/(Deficit) after capital transfers & contributions | 67 290 | 8 228 | (39 138) | 5 317 | 5 635 |
| Share of surplus/(deficit) of associate | - | - | - | - | - |
| Surplus/(Deficit) for the year | 67 290 | 8 228 | (39 138) | 5 317 | 5 635 |
| CAPITAL EXPENDITURE & FUNDS SOURCES | |||||
| Capital expenditure | 815 578 | 762 856 | 713 095 | 679 174 | 657 139 |
| Transfers recognised - capital | 741 867 | 685 006 | 643 966 | 612 699 | 564 243 |
| Borrowing | 670 | 670 | 670 | 670 | 312 |
| Internally generated funds | 73 040 | 77 179 | 68 459 | 65 805 | 58 451 |
| Total sources of capital funds | 815 578 | 762 856 | 713 095 | 679 174 | 623 006 |
| FINANCIAL POSITION | |||||
| Total current assets | 114 383 | 93 777 | 98 387 | 77 252 | 49 831 |
| Total non current assets | 468 429 | 438 329 | 415 719 | 407 260 | 406 509 |
| Total current liabilities | 159 685 | 221 861 | 224 361 | 160 240 | 158 971 |
| Total non current liabilities | 91 736 | 45 608 | 39 813 | 39 132 | 39 074 |
| Community wealth/Equity | 264 100 | 256 409 | 289 070 | 279 823 | 252 660 |
| CASH FLOWS | |||||
| Net cash from (used) operating | 236 875 | 182 544 | 68 953 | 26 005 | 9 010 |
| Net cash from (used) investing | (370) | (1) | - | - | - |
| Net cash from (used) financing | - | - | - | - | - |
| Cash/cash equivalents at the year end | 238 063 | 184 102 | 70 512 | 27 563 | 10 576 |
| UNAUTHORISED, IRREGULAR, FRUITLESS & WASTEFUL EXPENDITURE | |||||
| Unauthorised expenditure | n/a | - | 36 221 | 288 102 | 49 137 |
| Irregular expenditure | n/a | 23 948 | 16 673 | 17 044 | 17 734 |
| Fruitless & wasteful expenditure | n/a | 10 680 | 10 347 | 12 022 | 3 724 |
| SOURCE | Audited Outcome A1 2026 Q1 | Audited Outcome A1 2026 Q1 | Audited Outcome A1 2026 Q1 | Audited Outcome A1 2024 | Audited Outcome A1 2023 |
Employment Statistics
| 2022/23 | 2021/22 | 2020/21 | 2019/20 | 2018/19 | |
| Employment | |||||
| Employment Costs (R’000) | 135 383 | 123 339 | 132 726 | 124 149 | 126 639 |
| Remuneration of councillors (R’000) | 13 662 | 11 533 | 11 599 | 11 993 | 11 460 |
| Total Employee Positions | 299 | 284 | 299 | 307 | 345 |
| Total Vacant Employee Positions | 7 | 4 | 5 | 2 | 0 |
| Total Vacancy Percentage | 2.34% | 1.41% | 1.67% | 0.65% | 0.00% |
| Managerial Positions – S54A and S56 | 6 | 6 | 6 | 6 | 6 |
| Vacant Managerial Positions – S54A and S56 | 0 | 4 | 3 | 2 | 0 |
| Managerial Positions - by organogram | 27 | 27 | 27 | 37 | 19 |
| Vacant Managerial Positions - by organogram | 7 | 0 | 2 | 0 | 0 |
Service Delivery Statistics
| 2022/23 | 2021/22 | 2020/21 | 2019/20 | 2018/19 | |
| Water | |||||
| Does the municipality provide? | No | No | No | No | No |
| Number of households and non-domestic customers to which provided | 0 | 0 | 0 | 0 | 0 |
| Number of domestic households/delivery points | 0 | 0 | 0 | 0 | 0 |
| Inside the yard | 0 | 0 | 0 | 0 | 0 |
| Less than 200m from yard | 0 | 0 | 0 | 0 | 0 |
| More than 200m from yard | 0 | 0 | 0 | 0 | 0 |
| Domestic households with access to free basic service | 0 | 0 | 0 | 0 | 0 |
| Electricity | |||||
| Does the municipality provide? | Yes | Yes | Yes | Yes | Yes |
| Number of households and non-domestic customers to which provided | 32 116 | 32 116 | 32 116 | 29 427 | 29 427 |
| Domestic households with access to free basic service | 3 581 | 3 370 | 2 034 | 21 362 | 15 290 |
| Sewerage and Sanitation | |||||
| Does the municipality provide? | No | No | No | No | No |
| Number of households and non-domestic customers to which provided | 0 | 0 | 0 | 0 | 0 |
| Number of households using: | |||||
| Flush toilet - public sewerage | 0 | 0 | 0 | 0 | 0 |
| Flush toilet - septic tank | 0 | 0 | 0 | 0 | 0 |
| Ventilated pit latrine | 0 | 0 | 0 | 0 | 0 |
| Bucket system | 0 | 0 | 0 | 0 | 0 |
| Other | 0 | 0 | 0 | 0 | 0 |
| Domestic households with access to free basic service | 0 | 0 | 0 | 0 | 0 |
| Solid Waste Services | |||||
| Does the municipality provide? | Yes | Yes | Yes | Yes | Yes |
| Number of households and non-domestic customers to which provided | 13 336 | 9 219 | 9 219 | 9 219 | 9 219 |
| Domestic households with access to free basic service | 472 | 472 | 472 | 3 081 | 3 081 |