 A
A
Municipalities
Alfred Nzo District Municipality (DC44)
Metropolitan, district, and local municipalities across South Africa.
DC44
Active
https://www.andm.gov.za
Overview
Alfred Nzo District Municipality (DC44) is a district-level authority responsible for coordinating regional planning and supporting service delivery across its local municipalities. It plays a role in strategic development coordination, infrastructure planning, and inter-municipal support functions that require scale and collaboration. This profile consolidates public reference information and helps situate the district’s role within the wider municipal system.
Geography, History & Economy
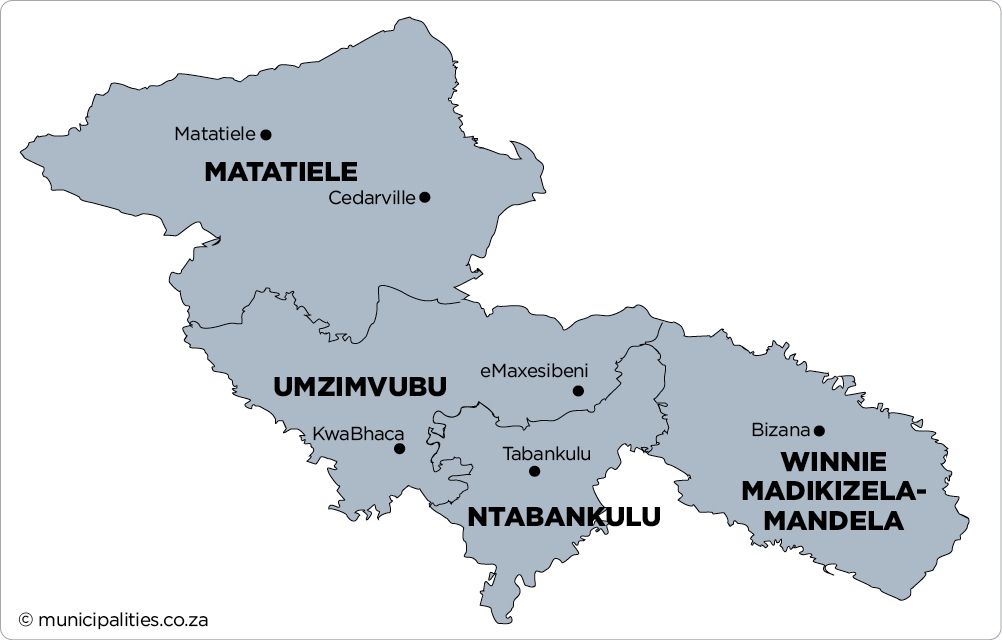
- Matatiele Local Municipality
- Ntabankulu Local Municipality
- Umzimvubu Local Municipality
- Winnie Madikizela-Mandela Local Municipality
Map
Council & Management
Composition of Council:
ANC 13, EFF 2, ATM 1, DA 1 (40% PR Seats)
Controlling Party:
ANC
Executive Mayor:
Ms Tsileng Sobuthongo (ANC)
Deputy Mayor:
Nomasomi Mshunqwana (ANC)
Speaker:
Sixolile Mehlomakhulu (ANC)
Chief Whip:
Nophatheka Ndabeni
Other Council:
Eunice Diko (Acting MMC: Community Development and Monitoring and Evaluation)
Mpumelelo Khuzwayo (MMC: Infrastructure and Planning)
Sobane Mnukwa (MMC: Budget and Treasury)
TR Nkomo (MMC: Corporate Services)
Nathi Nqoko (MMC: Water and Conservation)
Sandile Sello (MPAC Chairperson)
Municipal Manager:
n/a
Chief Financial Officer:
Ms Sihle Khuzo (Acting)
Senior Management:
M Khuzwayo (Head: Infrastructure Development and Municipal Services)
M Mbedla (Head: Community Development Services)
S Mnukwa (Head: Budget and Treasury Office)
N Mshuqwana (Mayoral Affairs)
TR Nkomo (Head: Corporate Services)
NN Nqoko (Head: Water Services Provision and Conservation)
B Qwayede (Head: Planning Economic Development)
Communications Officers:
Ms Nomasomi Mshunqwana (Head: Communications and Media Liaison)
Demographic Information
| 2022 | 2016 | 2011 | |
| Population | 936 462 | 867 864 | 801 344 |
| Age Structure | |||
| Population under 15 | 35.8% | 39.8% | 40.9% |
| Population 15 to 64 | 57.6% | 54.4% | 52.9% |
| Population over 65 | 6.6% | 5.8% | 6.2% |
| Dependency Ratio | |||
| Per 100 (15-64) | 73.7 | 83.8 | 88.9 |
| Sex Ratio | |||
| Males per 100 females | 88.4 | 84.4 | 84.3 |
| Population Growth | |||
| Per annum | 1.51% | 1.81% | n/a |
| Labour Market | |||
| Unemployment rate (official) | n/a | n/a | 43.5% |
| Youth unemployment rate (official) 15-34 | n/a | n/a | 52.3% |
| Education (aged 20 +) | |||
| No schooling | 8.2% | 9.1% | 13.6% |
| Matric | n/a | 16.5% | 12.6% |
| Higher education | 7.4% | 5.5% | 5.3% |
| Household Dynamics | |||
| Households | 198 300 | 195 975 | 169 258 |
| Average household size | 4.7 | 4.4 | 4.7 |
| Female headed households | n/a | 57.0% | 58.8% |
| Formal dwellings | 70.7% | 42.6% | 41.0% |
| Housing owned | n/a | 81.9% | 59.8% |
| Household Services | |||
| Flush toilet connected to sewerage | 22.7% | 4.2% | 6.6% |
| Weekly refuse removal | 21.8% | 5.3% | 6.3% |
| Piped water inside dwelling | 22.1% | 2.9% | 5.8% |
| Electricity for lighting | 90.3% | 63.1% | 46.2% |
Financial Results
| All values: R'000 | 2024/25 | 2023/24 | 2022/23 | 2021/22 | 2020/21 |
| AUDIT OUTCOME | n/a | Clean audit | Financially unqualified | Financially unqualified | Financially unqualified |
| FINANCIAL PERFORMANCE | |||||
| Property rates | - | - | - | - | - |
| Service charges | 23 842 | 23 091 | 26 255 | 26 413 | 26 691 |
| Investment revenue | 134 838 | 131 614 | 83 346 | 43 411 | 34 808 |
| Transfers recognised - operational | 815 381 | 750 269 | 729 617 | 643 121 | 696 279 |
| Other own revenue | 4 134 | 3 535 | 9 221 | 4 550 | 1 624 |
| Total Revenue (excluding capital transfers and contributions) | 978 194 | 908 509 | 848 440 | 717 495 | 759 402 |
| Employee costs | 326 261 | 310 465 | 286 350 | 267 816 | 271 860 |
| Remuneration of councillors | 12 447 | 12 148 | 12 140 | 10 499 | 10 824 |
| Depreciation and amortisation | 133 753 | 120 900 | 104 888 | 103 402 | 96 309 |
| Finance charges | - | - | - | 406 | 4 |
| Inventory consumed and bulk purchases | 86 871 | 68 439 | 66 350 | 26 658 | 25 000 |
| Transfers and subsidies | 21 708 | 21 346 | 40 977 | 18 011 | 17 776 |
| Other expenditure | 383 253 | 346 402 | 318 392 | 275 816 | 276 825 |
| Total Expenditure | 964 292 | 879 700 | 829 096 | 702 608 | 698 596 |
| Surplus/(Deficit) | 13 902 | 28 809 | 19 344 | 14 887 | 60 806 |
| Transfers and subsidies - capital (monetary allocations) | 487 356 | 507 320 | 548 681 | 709 573 | 492 477 |
| Transfers and subsidies - capital (in-kind) | - | 1 397 | - | - | - |
| Surplus/(Deficit) after capital transfers & contributions | 501 257 | 537 526 | 568 025 | 724 460 | 553 283 |
| Share of surplus/(deficit) of associate | - | - | - | - | - |
| Surplus/(Deficit) for the year | 501 257 | 537 526 | 568 025 | 724 460 | 553 283 |
| CAPITAL EXPENDITURE & FUNDS SOURCES | |||||
| Capital expenditure | 457 100 | 459 346 | 522 314 | 613 687 | 396 877 |
| Transfers recognised - capital | 407 538 | 353 603 | 485 693 | 606 960 | 401 226 |
| Borrowing | - | - | - | - | - |
| Internally generated funds | 49 563 | 105 744 | 30 964 | 6 356 | (9 739) |
| Total sources of capital funds | 457 100 | 459 346 | 516 658 | 613 316 | 391 487 |
| FINANCIAL POSITION | |||||
| Total current assets | 1 125 703 | 1 528 892 | 1 244 590 | 1 105 072 | 938 787 |
| Total non current assets | 6 639 824 | 5 826 146 | 5 452 351 | 5 074 205 | 4 550 034 |
| Total current liabilities | 270 774 | 363 026 | 246 084 | 297 221 | 321 665 |
| Total non current liabilities | 14 787 | 13 303 | 11 181 | 10 304 | 10 116 |
| Community wealth/Equity | 7 479 966 | 6 978 709 | 6 438 719 | 5 872 870 | 5 158 271 |
| CASH FLOWS | |||||
| Net cash from (used) operating | 1 144 753 | 537 811 | 736 147 | 1 665 025 | 1 090 392 |
| Net cash from (used) investing | (1 125 171) | (485 015) | (545 799) | (626 399) | (429 335) |
| Net cash from (used) financing | - | - | - | - | - |
| Cash/cash equivalents at the year end | 1 396 131 | 1 173 859 | 1 158 024 | 1 548 732 | 446 316 |
| UNAUTHORISED, IRREGULAR, FRUITLESS & WASTEFUL EXPENDITURE | |||||
| Unauthorised expenditure | n/a | - | - | - | - |
| Irregular expenditure | n/a | 6 915 | 33 426 | 103 562 | 84 390 |
| Fruitless & wasteful expenditure | n/a | - | - | 18 250 | 4 |
| SOURCE | Audited Outcome A1 2026 Q1 | Audited Outcome A1 2026 Q1 | Audited Outcome A1 2026 Q1 | Audited Outcome A1 2024 | Audited Outcome A1 2023 |
Employment Statistics
| 2022/23 | 2021/22 | 2020/21 | 2019/20 | 2018/19 | |
| Employment | |||||
| Employment Costs (R’000) | 286 350 | 267 816 | 271 860 | 268 322 | 244 076 |
| Remuneration of councillors (R’000) | 12 140 | 10 499 | 10 824 | 11 565 | 10 359 |
| Total Employee Positions | 609 | 626 | 600 | 591 | 511 |
| Total Vacant Employee Positions | 51 | 16 | 0 | 5 | 0 |
| Total Vacancy Percentage | 8.37% | 2.56% | 0.00% | 0.85% | 0.00% |
| Managerial Positions – S54A and S56 | 7 | 7 | 6 | 6 | 7 |
| Vacant Managerial Positions – S54A and S56 | 2 | 1 | 0 | 0 | 0 |
| Managerial Positions - by organogram | 49 | 49 | 34 | 35 | 39 |
| Vacant Managerial Positions - by organogram | 6 | 15 | 0 | 5 | 0 |
Service Delivery Statistics
| 2022/23 | 2021/22 | 2020/21 | 2019/20 | 2018/19 | |
| Water | |||||
| Does the municipality provide? | Yes | Yes | Yes | Yes | Yes |
| Number of households and non-domestic customers to which provided | 131 655 | 125 372 | 117 742 | 117 742 | 117 709 |
| Number of domestic households/delivery points | 130 705 | 124 422 | 116 792 | 116 792 | 116 759 |
| Inside the yard | 32 458 | 31 651 | 31 651 | 31 651 | 31 651 |
| Less than 200m from yard | 98 247 | 92 771 | 72 098 | 72 098 | 72 065 |
| More than 200m from yard | 0 | 0 | 13 043 | 13 043 | 13 043 |
| Domestic households with access to free basic service | 35 214 | 40 000 | 39 500 | 116 792 | 116 759 |
| Electricity | |||||
| Does the municipality provide? | No | No | No | No | No |
| Number of households and non-domestic customers to which provided | 0 | 0 | 0 | 0 | 0 |
| Domestic households with access to free basic service | 0 | 0 | 0 | 0 | 0 |
| Sewerage and Sanitation | |||||
| Does the municipality provide? | Yes | Yes | Yes | Yes | Yes |
| Number of households and non-domestic customers to which provided | 125 226 | 125 183 | 102 621 | 143 679 | 143 471 |
| Number of households using: | |||||
| Flush toilet - public sewerage | 24 483 | 24 483 | 8 712 | 8 712 | 8 712 |
| Flush toilet - septic tank | 8 829 | 8 829 | 2 713 | 2 713 | 2 713 |
| Ventilated pit latrine | 90 964 | 90 921 | 90 246 | 131 304 | 131 196 |
| Bucket system | 0 | 0 | 0 | 0 | 0 |
| Other | 0 | 0 | 0 | 0 | 0 |
| Domestic households with access to free basic service | 35 214 | 40 000 | 39 500 | 142 729 | 142 621 |
| Solid Waste Services | |||||
| Does the municipality provide? | No | No | No | No | No |
| Number of households and non-domestic customers to which provided | 0 | 0 | 0 | 0 | 0 |
| Domestic households with access to free basic service | 0 | 0 | 0 | 0 | 0 |